Forecast Origin Dates
J-SCOPE forecast results for the simulation beginning in January of 2017 are shown through a series of figures below. Each panel represents ensemble averaged anomalies of two month averages for the region. The lower panels depict the relative uncertainty from the ensemble for the same time period.
From the maps, oxygen is forecasted to be higher than the climatology over much of the upwelling season of 2017 in both Washington and Oregon. Oxygen is forecasted to be lower than the climatology on the shallow shelf beginning in March - April and continuing in some areas through the summer. The relative uncertainty ranges from 10% or less in May - June, with the exception of a few regions where uncertainty reaches 20%. The relative uncertainty gets higher on the shelf for the rest of the forecast (up to ~50%), and is generally higher in Oregon.
Time series of bottom oxygen from the Washington coast near one of the OCNMS moorings sited at Cape Elizabeth and from NH-10 on the Oregon shelf are shown from each member of the ensemble. The model forecasts that hypoxia will most likely develop at these locations in early June of 2017 (which is nearly equivalent to the climatological timing indicated by the green line), but may develop later. Another time series from the outer Washington shelf, Ćháʔba·, is also shown, and hypoxia is only forecast for one ensemble member (with low likelihood) at this location in August.
Finally, climatological cross-sections from the Newport Line in Oregon, as well as the Grays Harbor Line in Washington, are compared to the forecasted average of the ensemble members. In Oregon, the forecast projects that the oxygen concentration for the upwelling season of 2017 will be higher than the climatology in the subsurface (>100 m depth) and lower than the climatology in the surface layer. In Washington, the forecast projects that the oxygen concentration for the upwelling season of 2017 will be higher than the climatological values over much of the shelf.
The emergence of anoxia in the model is caused by a lack of relaxations in the winds (found to be important in a paper by Adams et al, 2013) in the CFS forcing as well as a positive bias in the short wave radiation (see 2013, Year in Review (2013, Year in Review). The model does have skill in predicting the emergence and severity of hypoxia, but is biased low for these reasons. Given the difficulty in predicting the fall transition in prior forecasts (2013, Year in Review), the forecast of low oxygen levels well into September is highly uncertain.
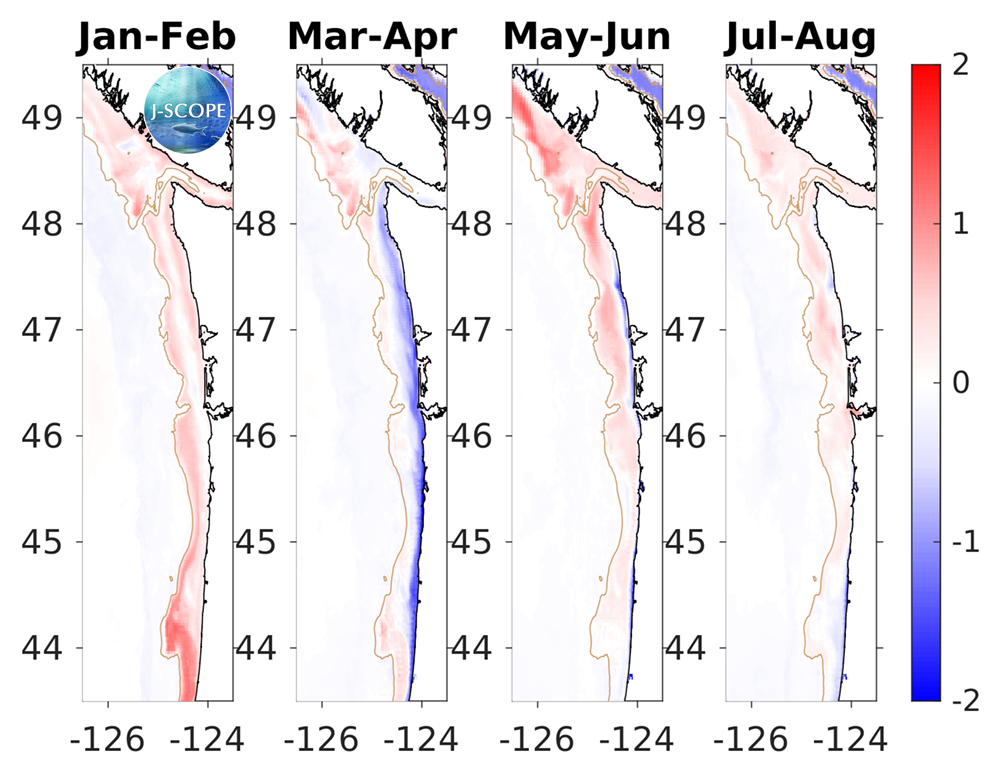
The modeled region bottom oxygen (ml/l) anomaly averaged over all three ensemble members and in time for (from left to right) January - February, March - April, May - June, and July - August. Hypoxia (1.4 ml/l) is outlined by the white contour.
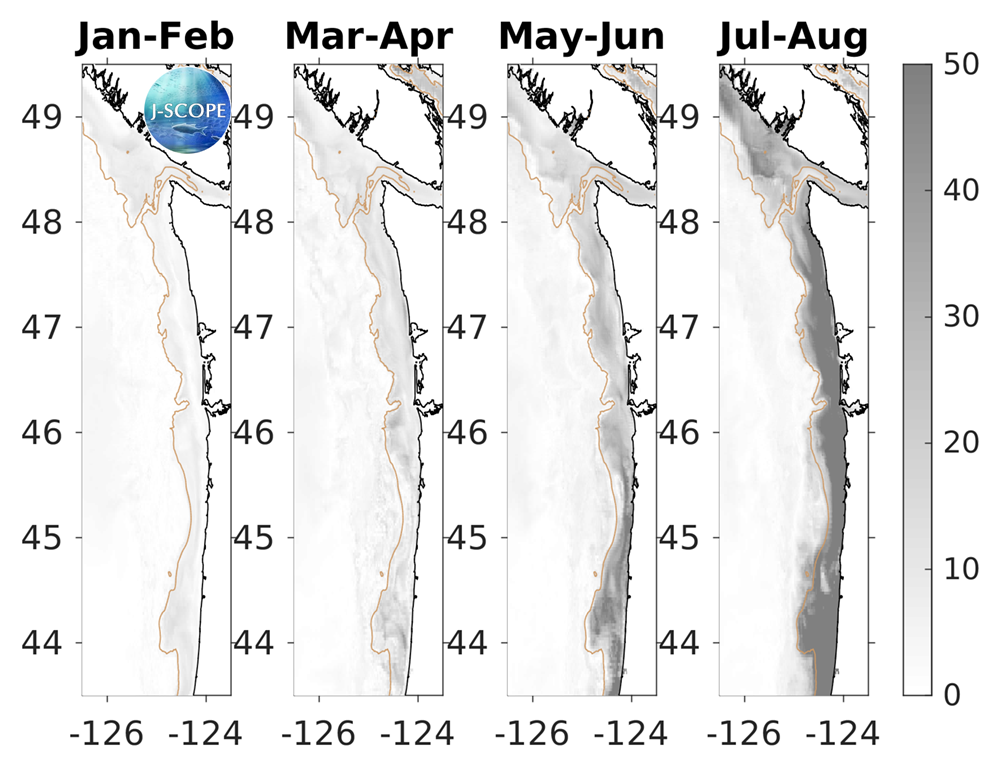
The relative uncertainty in percent for the modeled region bottom oxygen values averaged in time for (from left to right) January - February, March - April, May - June, and July - August. The relative uncertainty is defined as the standard deviation of the ensemble divided by the mean of the ensemble and is reported as a percentage of the mean.
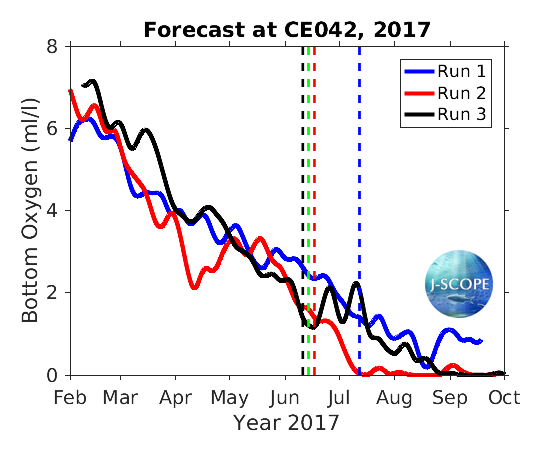
Time series for bottom oxygen at one of the Olympic Coast National Marine Sanctuary Moorings (CEO42, ~47.5 N) for each of the 3 ensemble members. Hypoxia is outlined but the blue region on the plot. The timing of each run’s onset of hypoxic conditions for more than 8 days is identified by the vertical dotted lines, with the green line indicating the climatological timing.
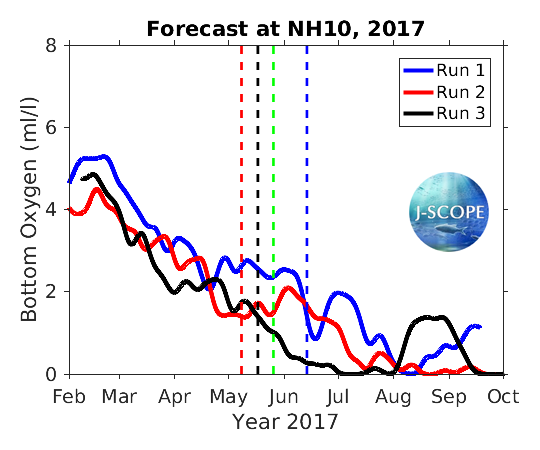
Time series for bottom oxygen at the NH-10 (~44.5 N) for each of the 3 ensemble members. Hypoxia is defined as less than 1.4 ml/l in these units in this region. The timing of each run’s onset of hypoxic conditions for more than 8 days is identified by the vertical dotted lines, with the green line indicating the climatological timing.
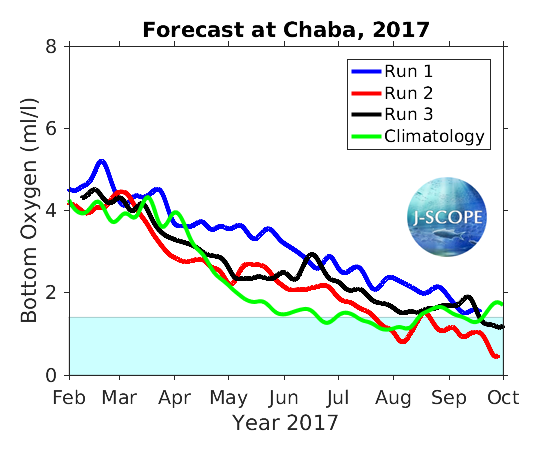
Time series for bottom oxygen at Ćháʔba· (~48 N) for each of the 3 ensemble members. Hypoxia is defined as less than 1.4 ml/l in these units in this region.The timing of each run’s onset of hypoxic conditions for more than 8 days is identified by the vertical dotted lines, with the green line indicating the climatological timing.
The modeled cross-section from the Newport Line (left) and the Grays Harbor Line (right), averaged over all three ensemble members, and averaged over the summer upwelling months.