Forecast Origin Dates
J-SCOPE forecast results for the simulation beginning in April of 2017 are shown through a series of figures below. In the first figure, each panel represents ensemble averaged anomalies of two month averages for the region. In the second figure, the panels depict the relative uncertainty from the ensemble for the same time periods.
From the maps, oxygen is forecasted to be higher than the climatology throughout the upwelling season of 2017 in both Washington and Oregon. Oxygen is forecasted to be lower than the climatology on the shallow shelf beginning in September and continuing through the fall. The relative uncertainty ranges from 10% or less in May - June, with the exception of a few regions where uncertainty reaches 20%. The relative uncertainty gets higher (up to ~50%) on the shelf in the fall (September - October, November - December).
Time series of bottom oxygen from the Washington coast near one of the Olympic Coast National Marine Sanctuary (OCNMS) moorings at Cape Elizabeth (site CE042), from NH-10 mooring off of Newport, Oregon, and from the Ćháʔba· mooring off of La Push, Washington, are shown for each member of the ensemble. The model forecasts that hypoxia will most likely develop at the NH-10 and CE042 moorings in late July, which is about one month later than the climatological onset of hypoxia. Another time series from the outer Washington shelf, Ćháʔba·, forecasts hypoxia onset in two of the three ensemble members between August and mid-October at this location.
Finally, climatological cross-sections from the Newport Line in Oregon (44°N) and the Grays Harbor Line in Washington (47°N) are compared to the forecasted average of the ensemble members during the summer upwelling season (May - August). In Oregon, the forecast projects that the oxygen concentration for the upwelling season of 2017 will be higher than the climatology subsurface (>400 m depth) and lower than the climatology on the shelf (<200 m depth). In Washington, the forecast projects that the oxygen concentration for the upwelling season of 2017 will be higher than the climatology on the shelf (<200 m depth), but lower than the climatology at deeper depths (>500 m).
The emergence of anoxia in the model is caused by a bias associated with the lack of relaxations in the winds (found to be important in a paper by Adams et al, 2013) in the Climate Forecast System input files as well as a bias in the shortwave radiation (see 2013, Year in Review (2013, Year in Review). The model does have skill in predicting the emergence and severity of hypoxia, while it is biased low for these reasons. Given the difficulty in predicting the fall transition in prior forecasts (2013, Year in Review), the forecast of low oxygen levels well into September is highly uncertain.
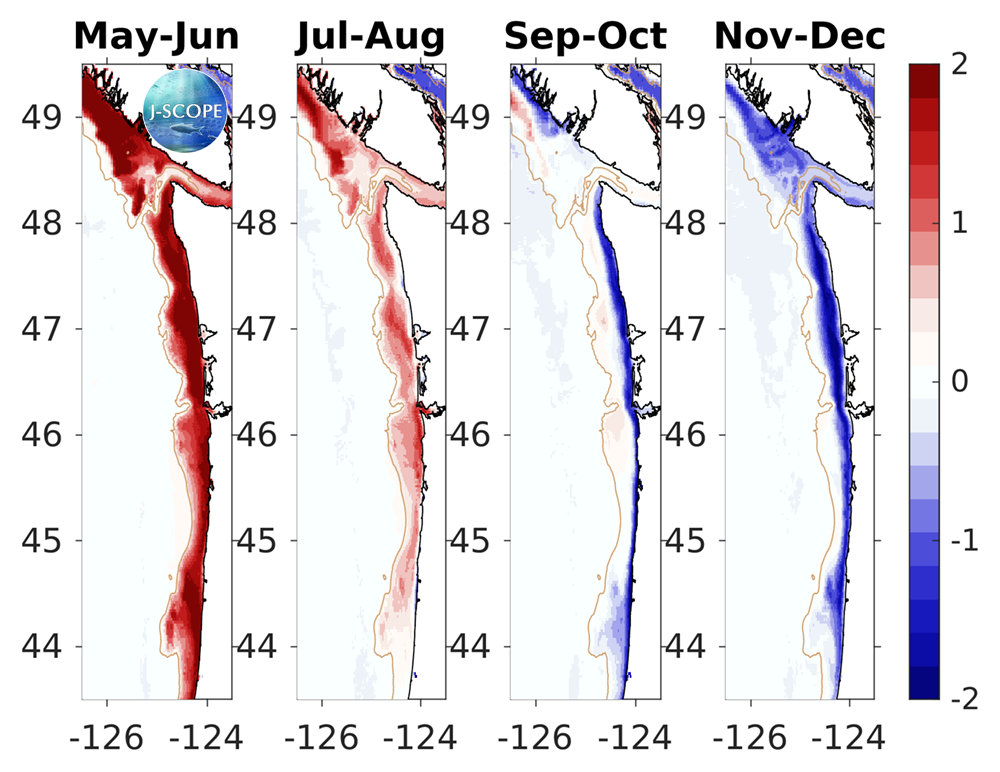
The modeled region bottom oxygen (ml/l) anomaly averaged over all three ensemble members and in time for (from left to right) May - June, July - August, September - October, and November - December. Hypoxia (1.4 ml/l) is outlined by the white contour.
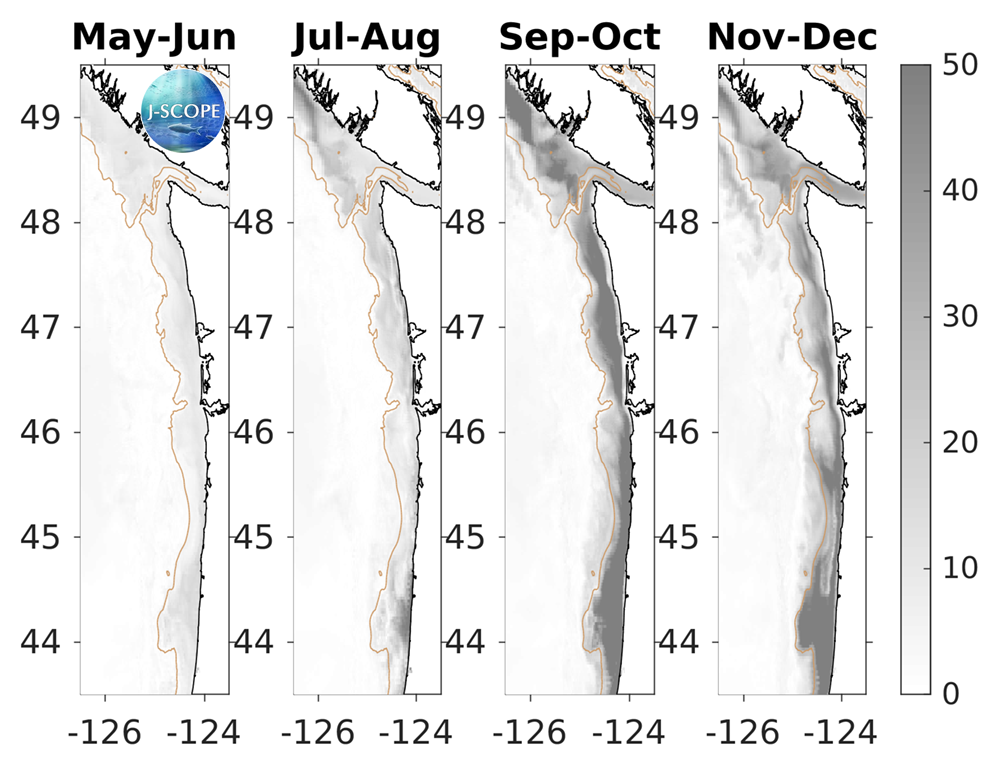
The relative uncertainty in percent for the modeled region bottom oxygen values averaged in time for (from left to right) May - June, July - August, September - October, and November - December. The relative uncertainty is defined as the standard deviation of the ensemble divided by the mean of the ensemble and is reported as a percentage of the mean.
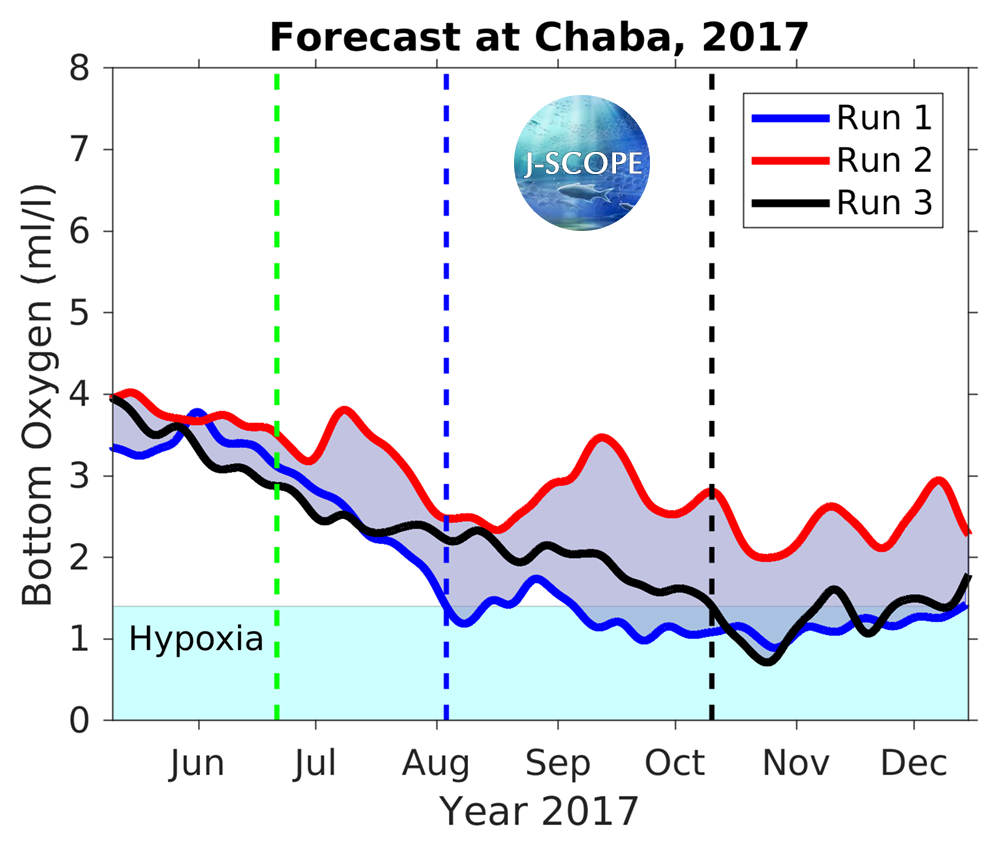
Time series for bottom oxygen at Ćháʔba· (~48°N) for each of the three ensemble members. Hypoxia is outlined by the blue region on the plot. The timing of each run’s onset of hypoxic conditions for more than 8 days is identified by the vertical dotted lines, with the green line indicating the climatological timing.
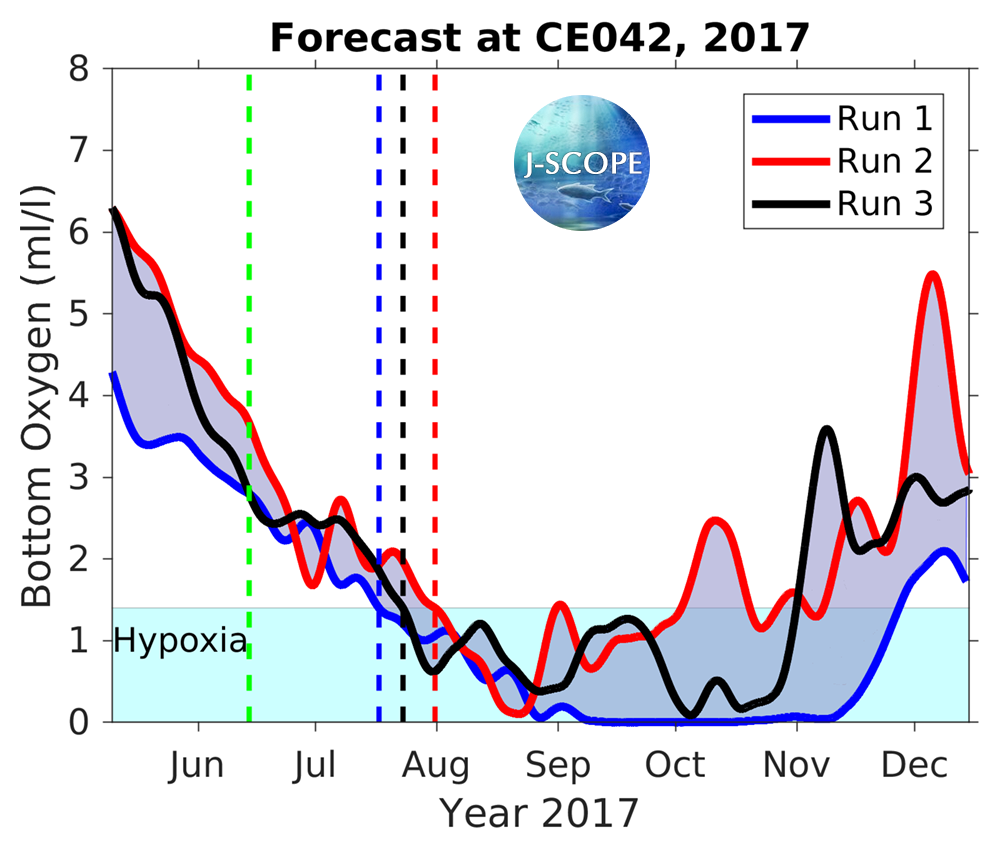
Time series for bottom oxygen at one of the Olympic Coast National Marine Sanctuary Moorings (CEO42, ~47.5°N) for each of the 3 ensemble members. Hypoxia is outlined by the blue region on the plot. The timing of each run’s onset of hypoxic conditions for more than 8 days is identified by the vertical dotted lines, with the green line indicating the climatological timing.
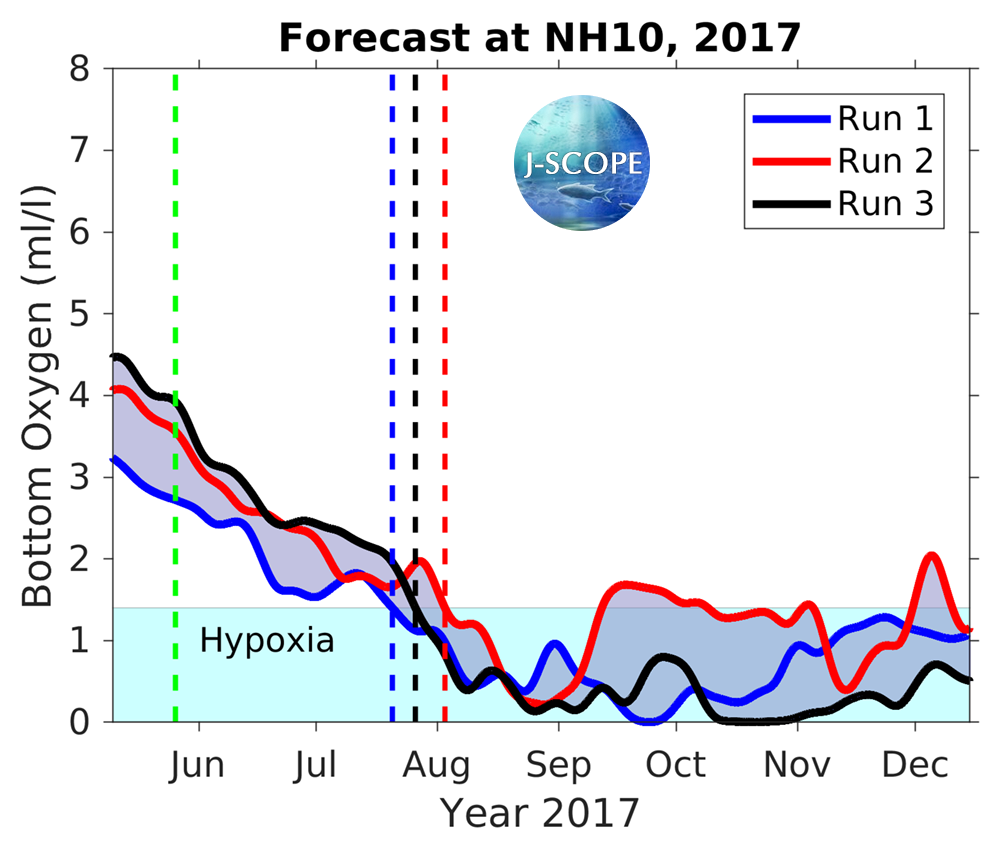
Time series for bottom oxygen at the NH-10 (~45°N) for each of the three ensemble members. Hypoxia is outlined by the blue region on the plot. The timing of each run’s onset of hypoxic conditions for more than 8 days is identified by the vertical dotted lines, with the green line indicating the climatological timing.
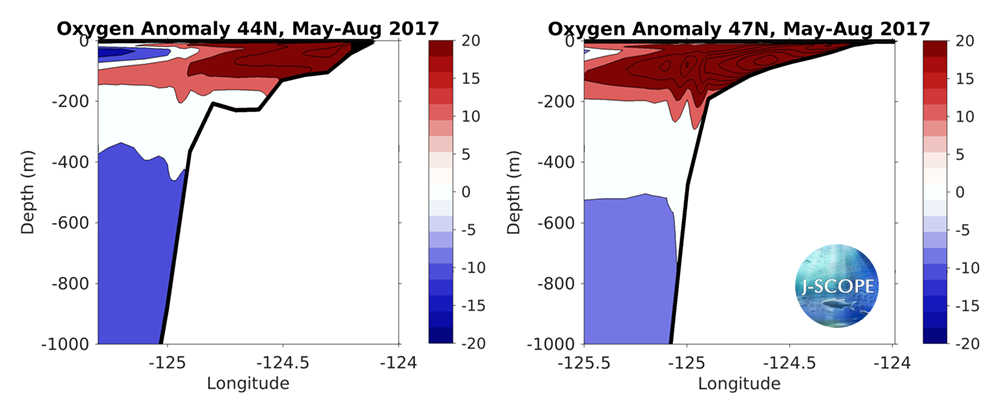
The modeled cross-section from the Newport Line off Oregon (left, 44°N) and the Grays Harbor Line off Washington (right, 47°N), averaged over all three ensemble members, and averaged over the summer upwelling months (May - August).