Honshu Earthquake and Tsunami 2011
From Jonathan Allan, NANOOS Principal Investigator, NANOOS Chair of the User Products Committee, and Coastal Geomorphologist at the Oregon Department of Geology and Mineral Industries (DOGAMI) and Rob Witter, Regional Coastal Geologist at DOGAMI:
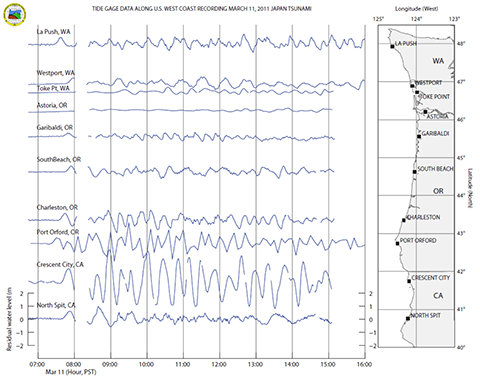
"The following plot shows the residual 1-minute water levels, or the difference between the predicted and the measured tide, for multiple tide gauges along the Pacific Northwest coast (northern WA (La Push) to northern CA (Humboldt Bay/North Spit) from 7am to 4pm on March 11th. The data in these graphs show the alongshore varying response in water levels, characterized by a progressive increase in the water levels (non-tidal residuals) from the Garibaldi gauge in northern Oregon southward to Port Orford and ultimately Crescent City, where the largest waves were observed, and a similar increase in residuals, albeit much smaller, from Astoria northward into northern WA with the largest waves observed at La Push. Crescent City, CA was the hardest hit city in the NANOOS region. Also of interest, the tsunami waves remained large throughout most of the day on March 11, reinforcing the importance of staying off the beaches and away from low-lying areas during these events until the all-clear is sounded by emergency managers."
From Steve Rumrill, NANOOS Principal Investigator and Research Program Coordinator for the South Slough National Estuarine Research Reserve in Coos Bay, OR:
"Our NERR/SWMP/NANOOS data loggers are still in the water and the sensors are fully operational. The real-time GOES telemetry transmissions are intermittent and are not working right now, but the time-series data are captured by the internal memory inside the sensors. We will let the tsunami surges complete their reverberations for another day and then retrieve the data loggers and download the water-level data on Tue-Wed."
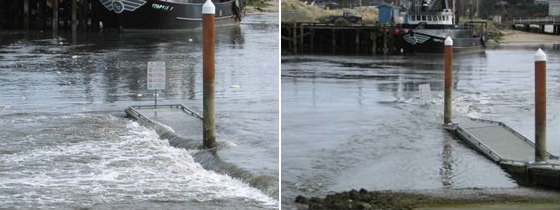
The tsunami surges entered Coos Bay and South Slough Friday morning with an amplitude of about 3-5 ft, and the surges were repeated throughout Friday and Saturday followed by diminished surges on Sunday-Monday. The photo on the left shows the tsunami surge sweeping over the Charleston Boat Launch dock as it flows up into the inner boat basin. The photo on the right shows the boat launch dock submerged again as the tsunami surge flowed back out of the inner boat basin. The tidal channels of South Slough also filled and drained rapidly numerous times over the weekend, but we did not experience any standing waves. Stay tuned for some graphics that illustrate the timing and amplitude of the tsunami surges in South Slough.
From Pat Corcoran, NANOOS Governing Council and Education & Outreach Committee member, and Coastal Hazards Outreach Specialist for Oregon Sea Grant:
"The official emergency response on the North coast went well and there was no damage."
His worry is that, yes, we were prepared for a 9 hour warning of a 2 foot tsunami (on the North coast) occurring during an 8 foot ebb tide, but what about when the earthquake happens here? The latest estimate of the probability of a 9.0 or greater magnitude earthquake occurring in the Cascadian Subduction Zone just off the coast of Oregon and Washington is a 37% chance that it will occur in the next 50 years. When this earthquake occurs, people in coastal areas will have 15-30 minutes to get to ground that’s higher than 50 feet elevation. Are we prepared for what we saw in the tsunami videos from Japan? We still have a lot of work to do, including identifying the safe high ground along the coast, especially near populated and popular areas, and increasing access and assembly areas at those sites. Some of this work includes clearing dense blackberry and salal from these areas.
Other Resources
Oregon and Washington Earthquake and Tsunami Resources
Oregon DOGAMI Tsunami Information Clearinghouse
Washington Emergency Management
Washington Department of Natural Resources
Washington Tsunami Evacuation Map
Related to the March 11th Honshu Earthquake and Tsunami
United States Geological Survey (USGS)
National Oceanic and Atmospheric Administration Pacific Marine Environmental Lab (NOAA PMEL)
| National Observing System Partners Alliance for Coastal Technologies (ACT) Southeastern Universities Research Association (SURA) Integrated Ocean Observing System IOOS | |||||||