Forecast Origin Dates
The J-SCOPE forecast system for Washington and Oregon coastal waters presents preliminary results for the 2025 upwelling season. The CFS forecast indicates ENSO-neutral conditions are favored through the Northern Hemisphere summer 2025 (74% chance during June-August), and into fall with chances exceeding 50% through August-October 2025. In comparison to the climatological data, during the summer upwelling season (May-August), coastal regions are forecasted to have near climatological sea surface temperatures (SST) throughout the upwelling season. Subsurface temperatures are forecasted to be lower over both the Washington Oregon shelves. Bottom oxygen is forecasted to be lower over both the Washington Oregon shelves with subsurface oxygen anomalies extending down the slope regions. Hypoxia is forecasted earlier than climatological (June) at both CEO42 and NH10, with one ensemble member developing hypoxia in May. Hypoxia is forecasted to develop at Ćháʔba· as well. Chlorophyll concentrations vary spatially but are forecasted to be higher on the early portion of the upwelling season and lower over latter portion. Bottom Ω is forecasted to be undersaturated throughout the upwelling season. Surface Ω is forecasted to be supersaturated throughout the upwelling season for all coastal areas.
The forecast system predicts the sea-surface temperature (SST), chlorophyll stock, dissolved oxygen, and sardine habitat. The forecast for 2025 is composed of three model runs that make up an ensemble. Each model run is initialized at a different time (April 6, April 15, April 25), and has complementary forcing files from the large scale model, CFS. The details of the wind forcing for each model run can be found on the California Current Indicators tab. For each of the predicted quantities listed above, we report the ensemble average anomaly as well as the relative uncertainty within the ensemble, which is defined as the standard deviation of the ensemble divided by the mean of the ensemble and is reported as a percentage of the mean. All of these quantities are reported as monthly averaged anomalies from our April-initialized reforecast climatology, which spans 2009-2017. An anomaly is an indication of how different conditions are to what they have been in the past. For more information about anomalies, please see the NANOOS NANOOS Climatology App. These predicted quantities are key indicators for the California Current Integrated Ecosystem Assessment report.
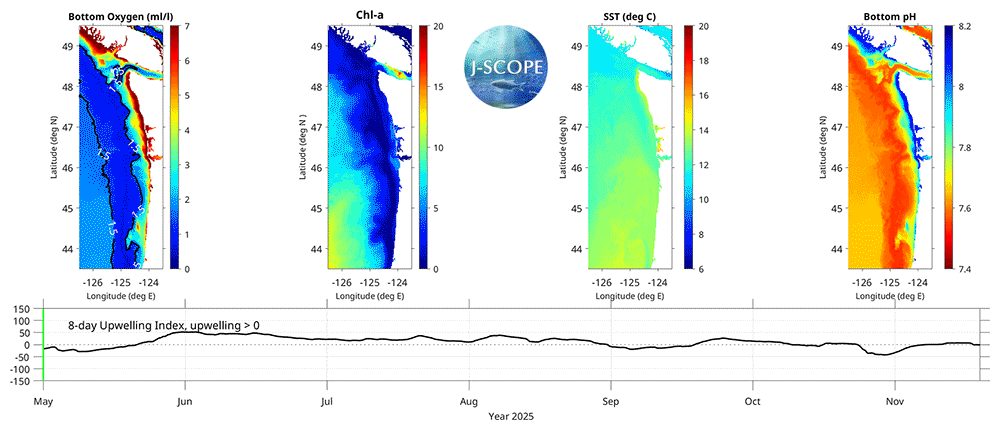
The movie above shows the J-SCOPE forecast for 2025, from ensemble model run 3 initialized on April 25. More information about the three panels on the left can be found by navigating the Oxygen, Chlorophyll, and Sea Surface Temperature tabs above. The panel on the far right depicts the evolution of bottom water pH over the forecast period. The 8-day upwelling index is calculated using the method described in Austin and Barth (2002) and can also be found under the California Current Indicators tab above.