Puget Sound Metrics
How does weather affect Puget Sound's temperature?
This metric shows when the atmosphere is warming or cooling Puget Sound. By comparing observations to the average, we can see excursions in either case. Above average warming (orange area) indicates when Puget Sound is receiving more than normal heat, and the converse indicated by blue area. A second plot shows how the accumulation of this warming or cooling would change the water temperature in the absence of other influences. Because of the dominant influence of solar radiation, i.e. sunshine, on heating, water stratification, and phytoplankton bloom formation, we include two plots for just this quantity as well. We look at two different general regions in Puget Sound (north and central) because of consistent differences we've seen between the two locations.
With this metric, we can evaluate the cause of temperature changes: A strong correlation of observed seawater temperature anomalies with those in surface heating indicate that temperature anomalies are mostly being driven locally, and not due to source water changes; a weak correlation would suggest source water changes are driving the Puget Sound temperature anomalies. Read More
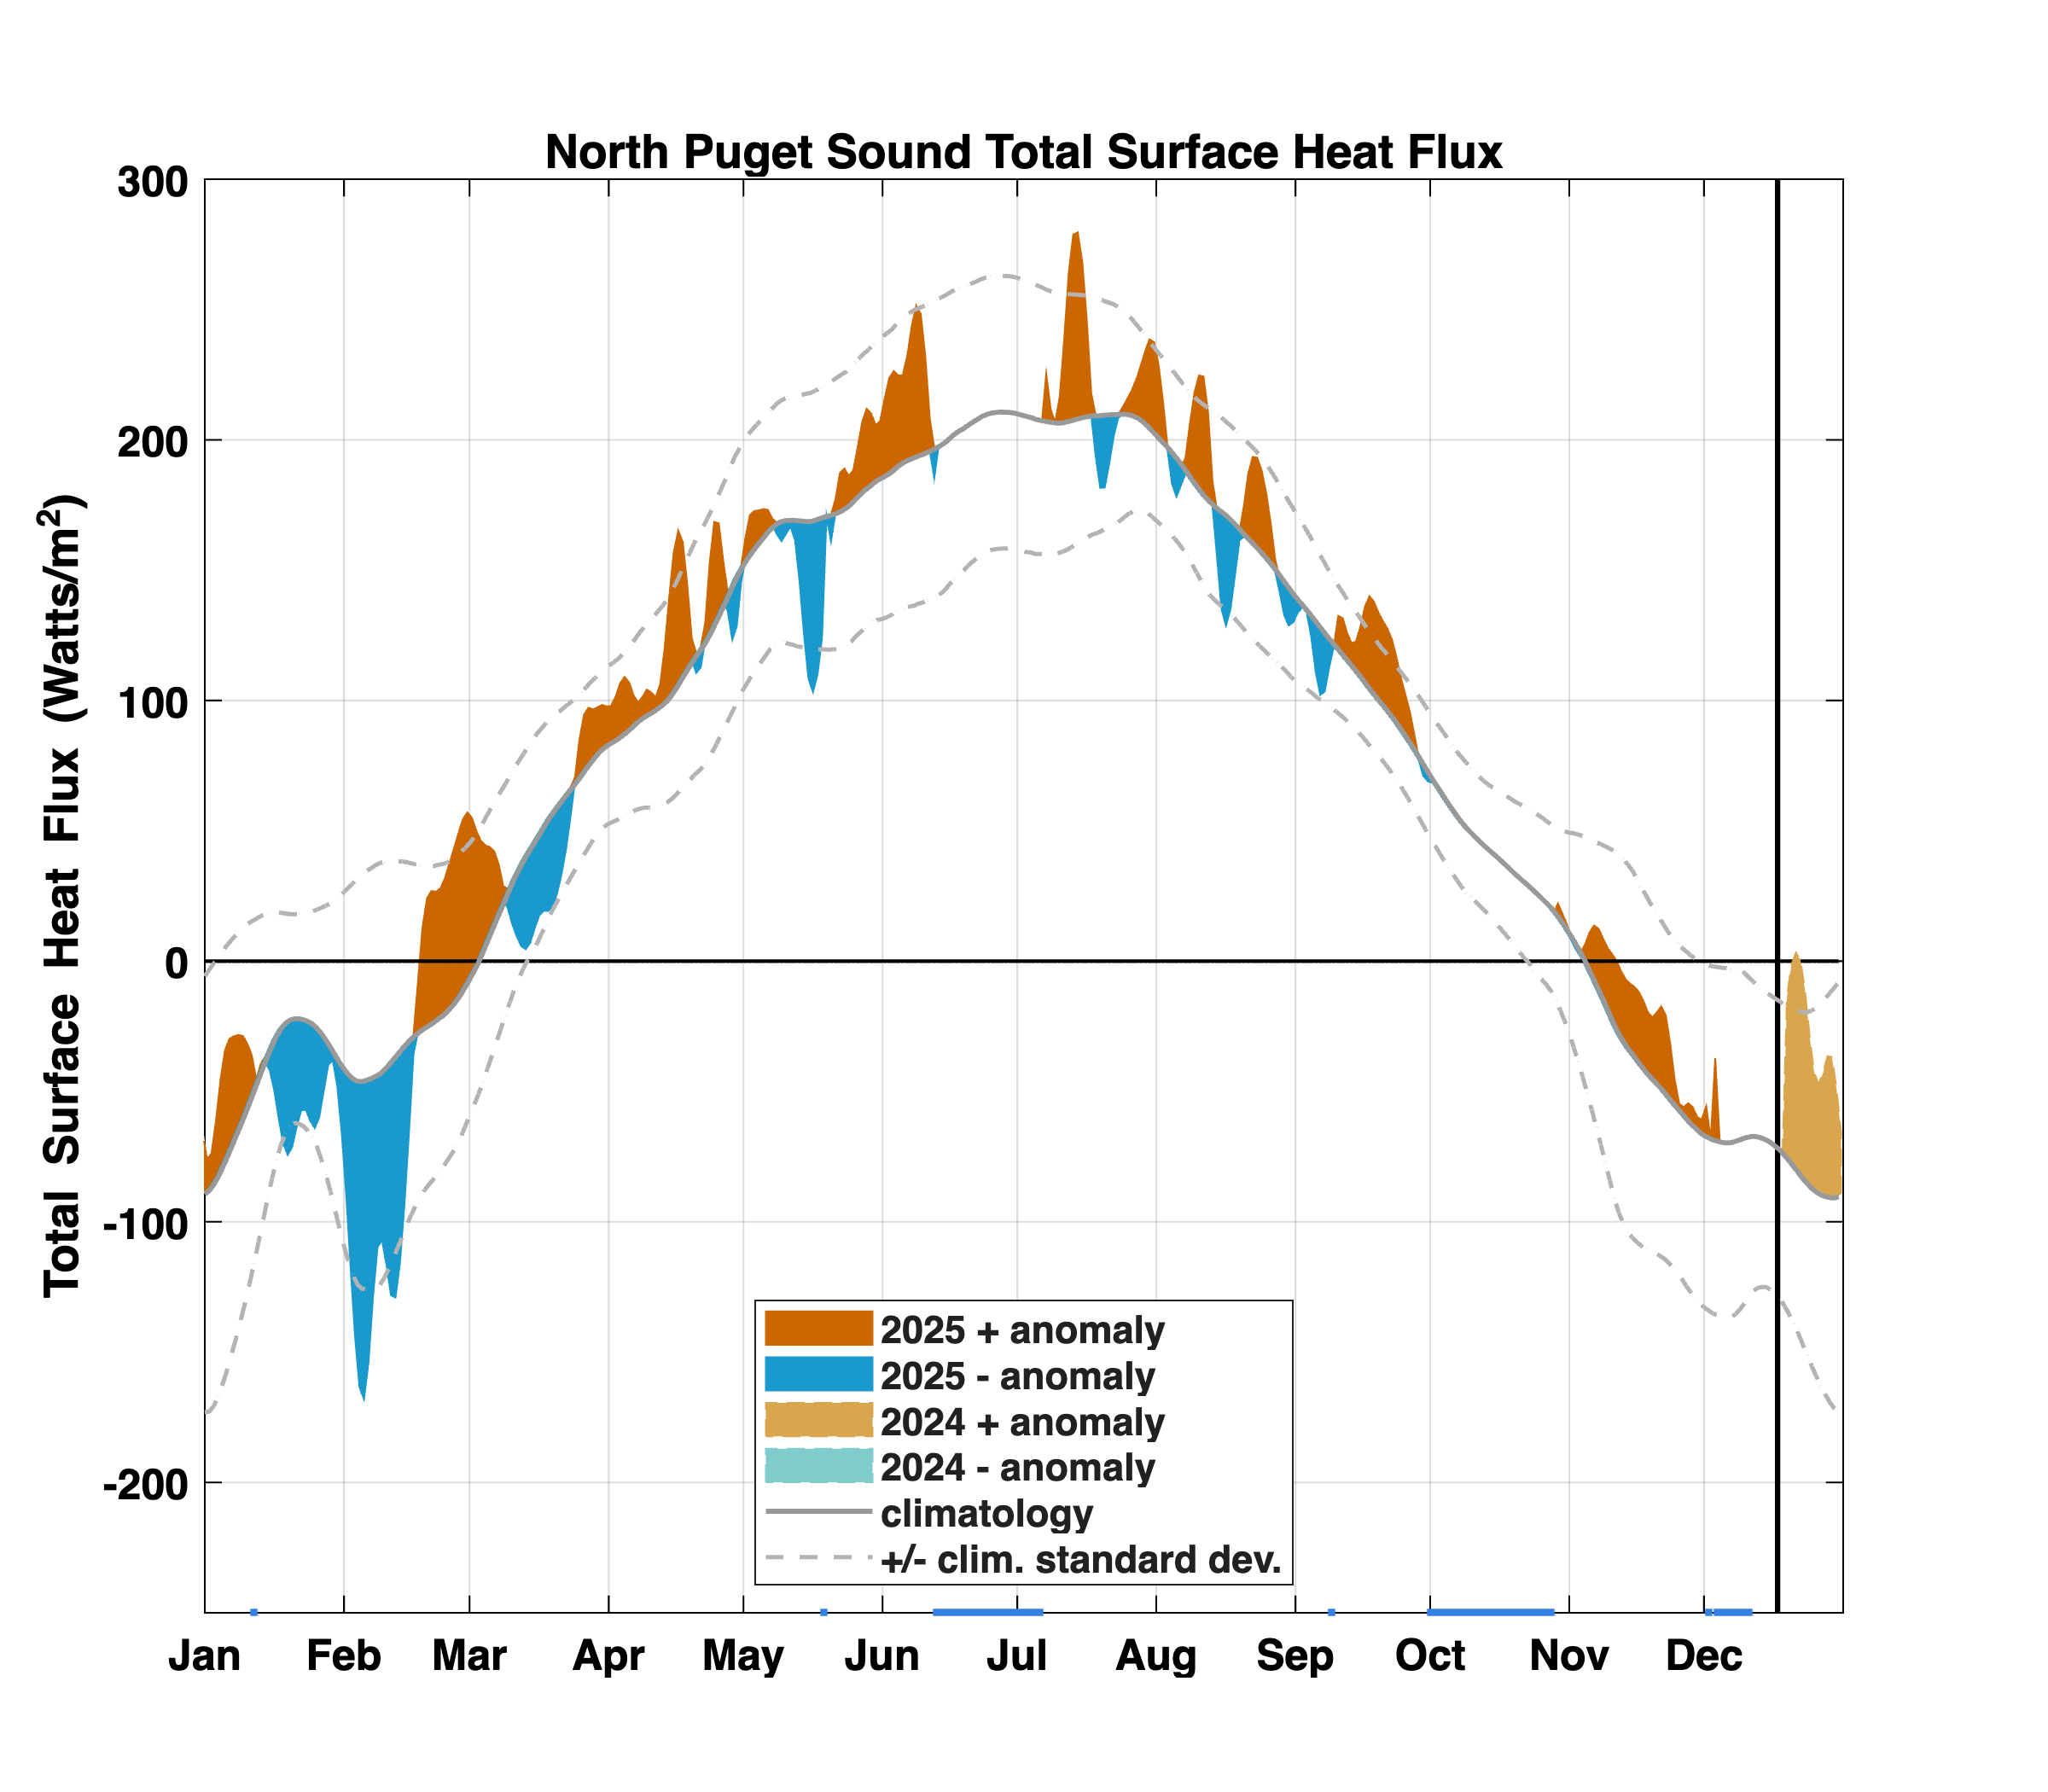
Total through-surface heating rate at the North Sound location with anomalies from an average rate from 2014 through 2020 (gray). Dashed lines indicated one standard deviation about the mean, which represents the seasonal cycle of heating/cooling.
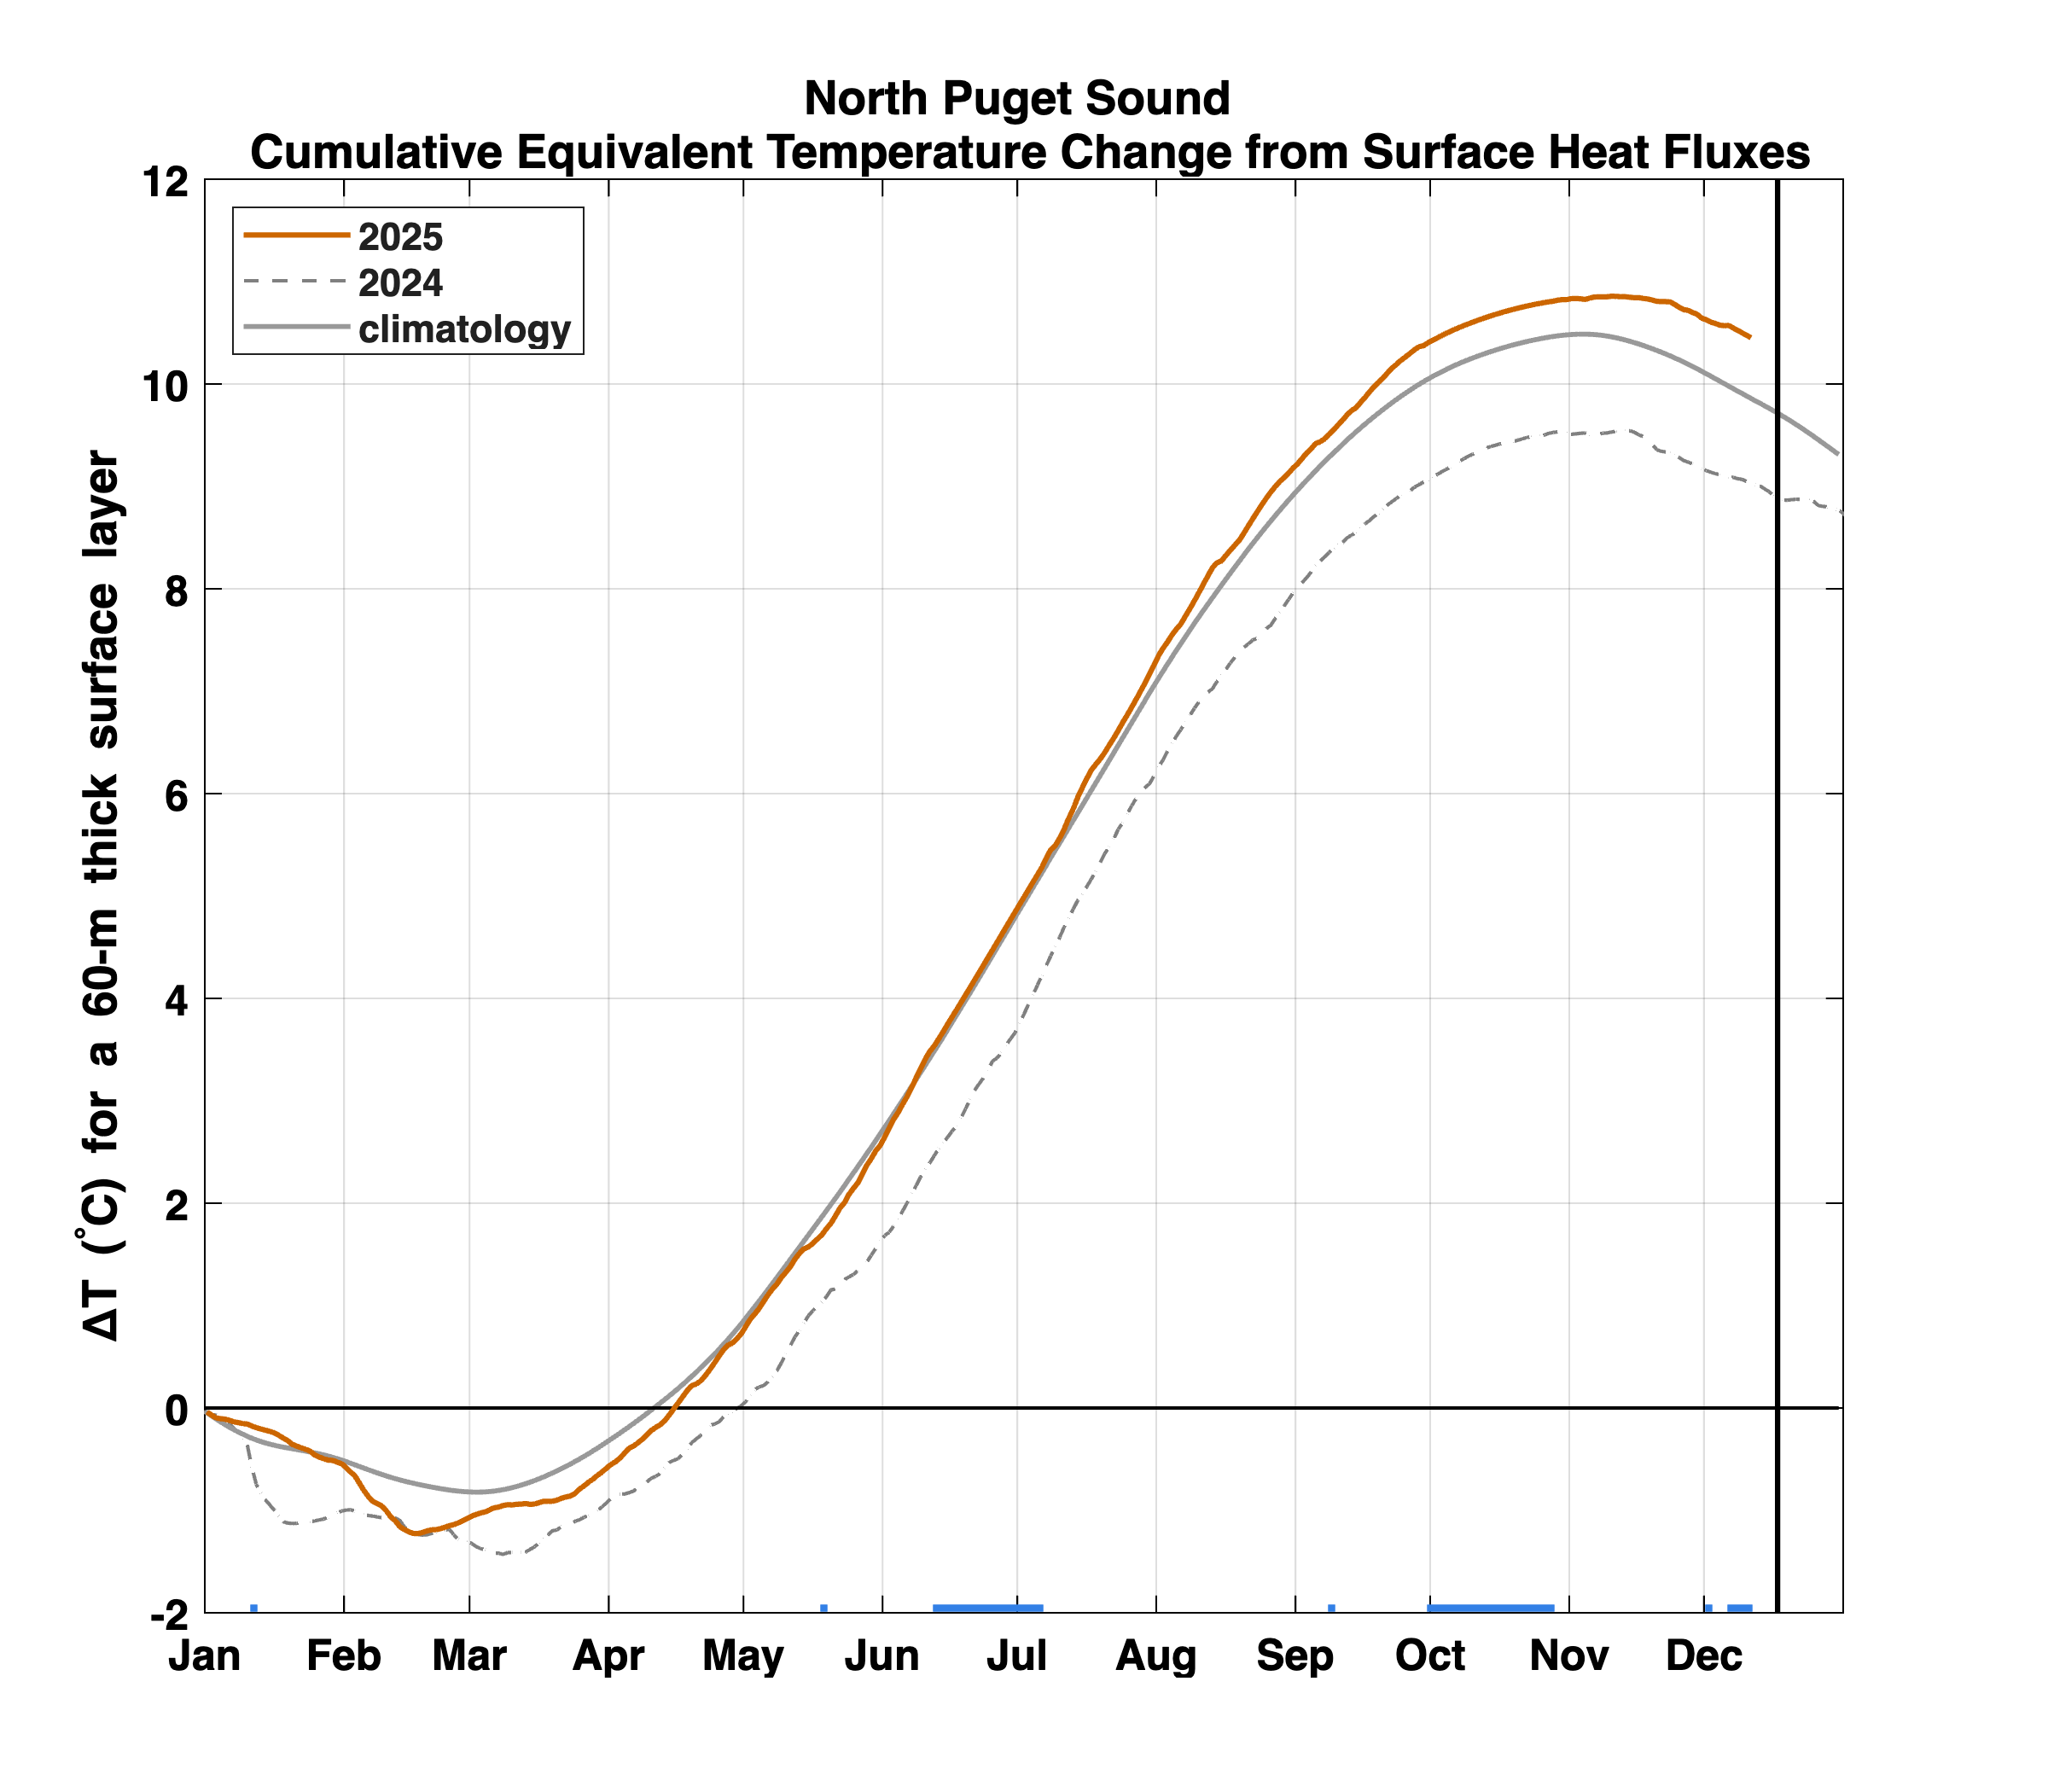
North Sound location equivalent change in temperature from accumulated heat gain or loss over a fixed 60 m water depth starting on January 1. This depth was chosen based on sill depths and wind-mixing depths. Reducing this thickness would proportionally increase the heating (a 30-m layer would warm twice as much), increasing it would proportionally decrease the cumulative heating. Observed changes in warming/cooling that are different than this would be due to differences in vertical heat distribution, the influence of lateral advection or spatial variability (or errors) in the surface heat fluxes. The deviations from the climatology in this plot are typically due to long-term (week and longer) trends and not daily differences.
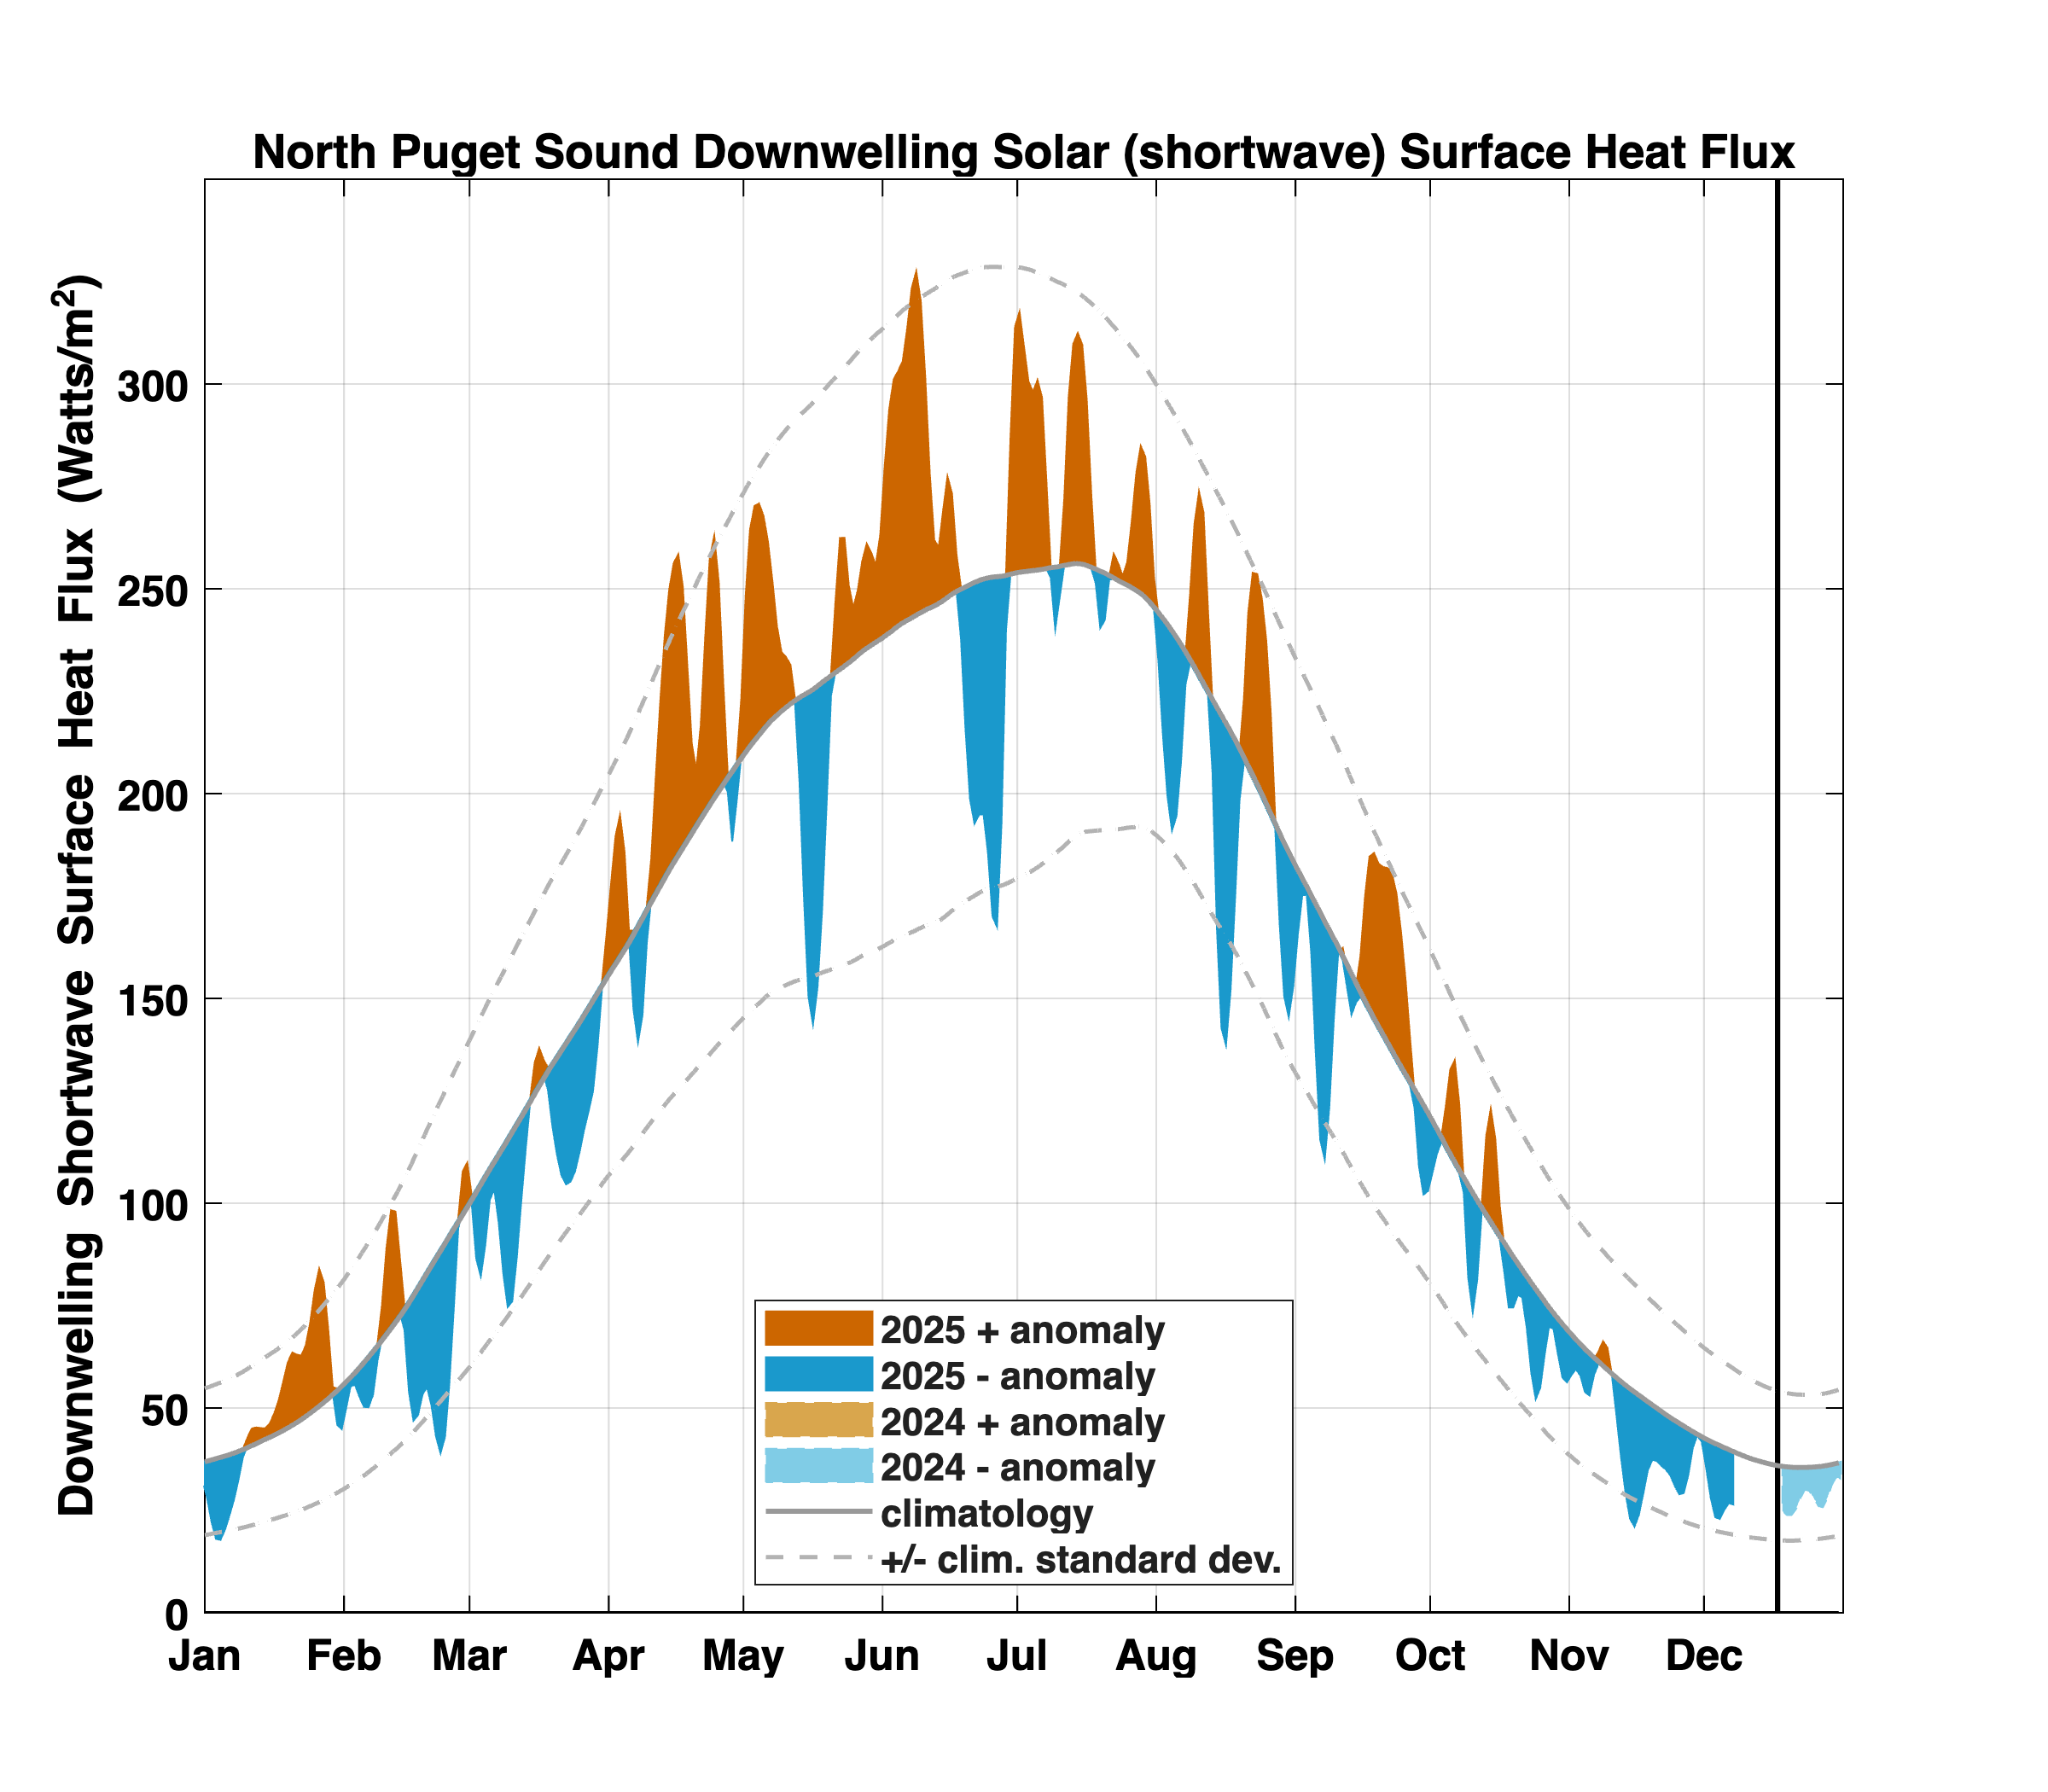
Downwelling, through-surface solar (shortwave) heat flux at the North Sound location with anomalies from an average rate from 2014 through 2020 (gray). Dashed lines indicated one standard deviation about the mean, which represents the seasonal cycle.
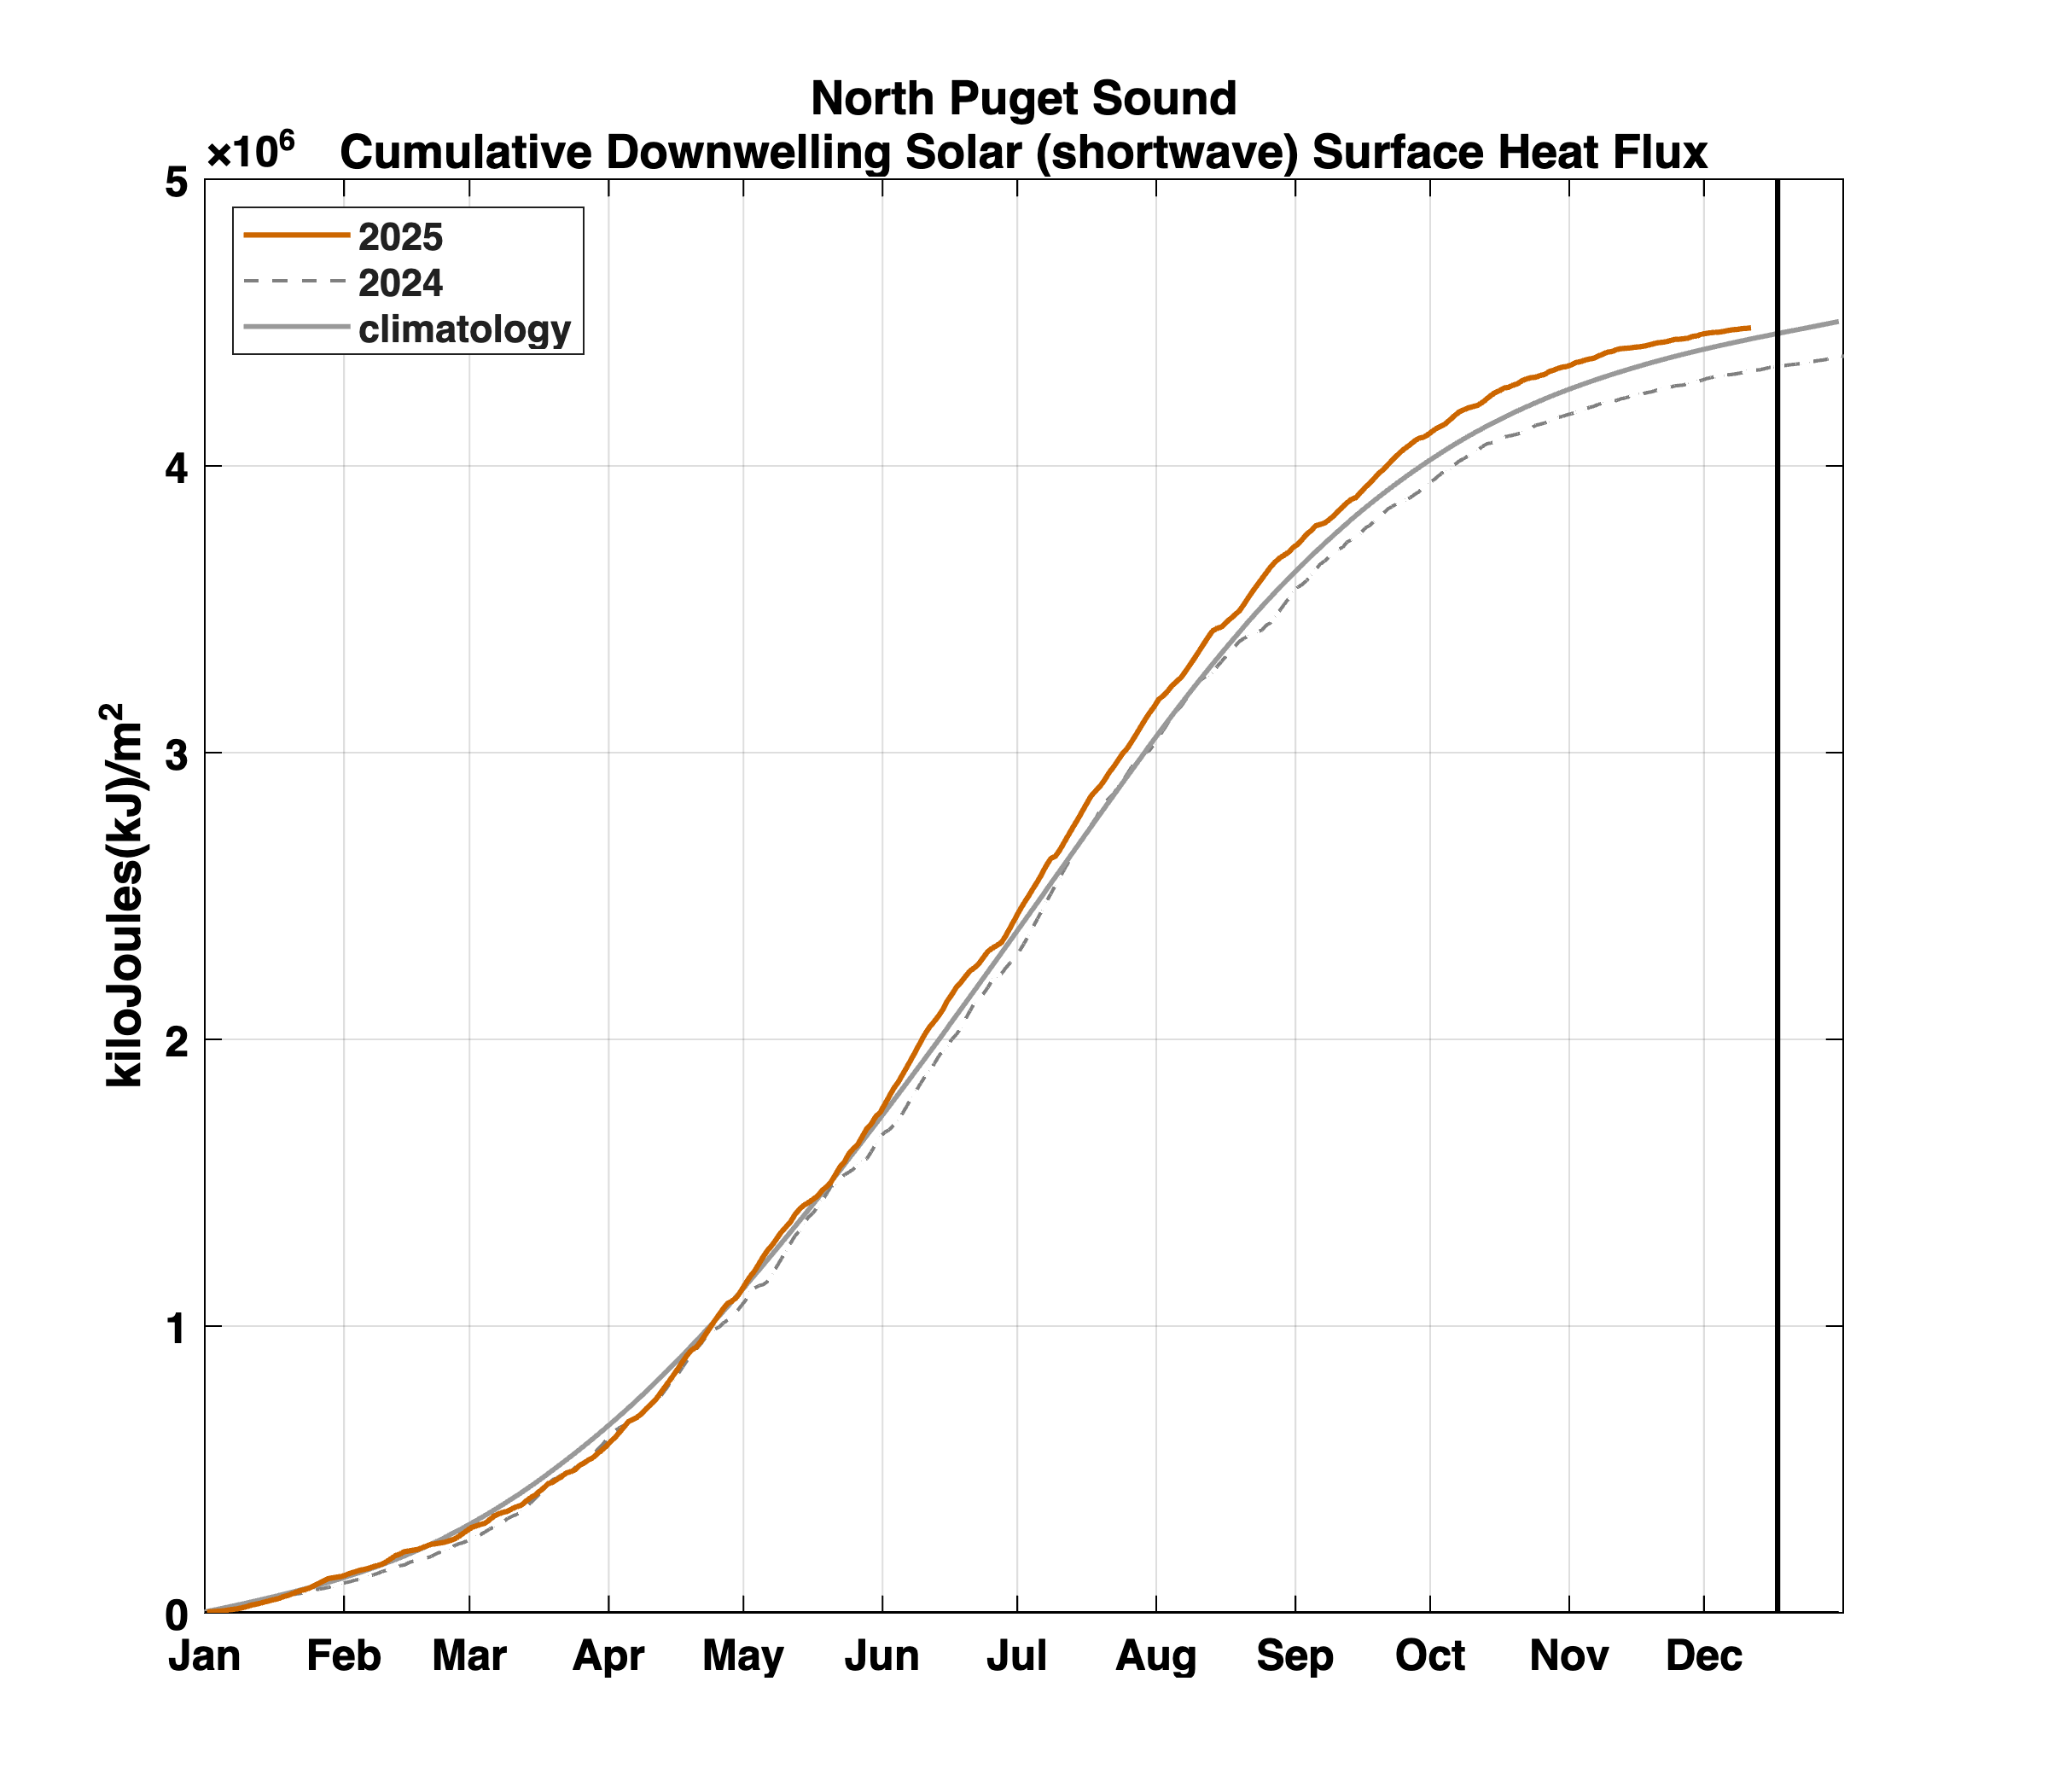
North Sound location cumulative downwelling solar (shortwave) heat flux compared to climatology (2014-2020). Like with the accumulated heat flux, deviations from the climatology in this plot are typically due to long-term (week and longer) trends and not daily differences.
Station Data
Climatology and anomaly values are calculated for various stations in Puget Sound. To view this information, you can select from the stations below.
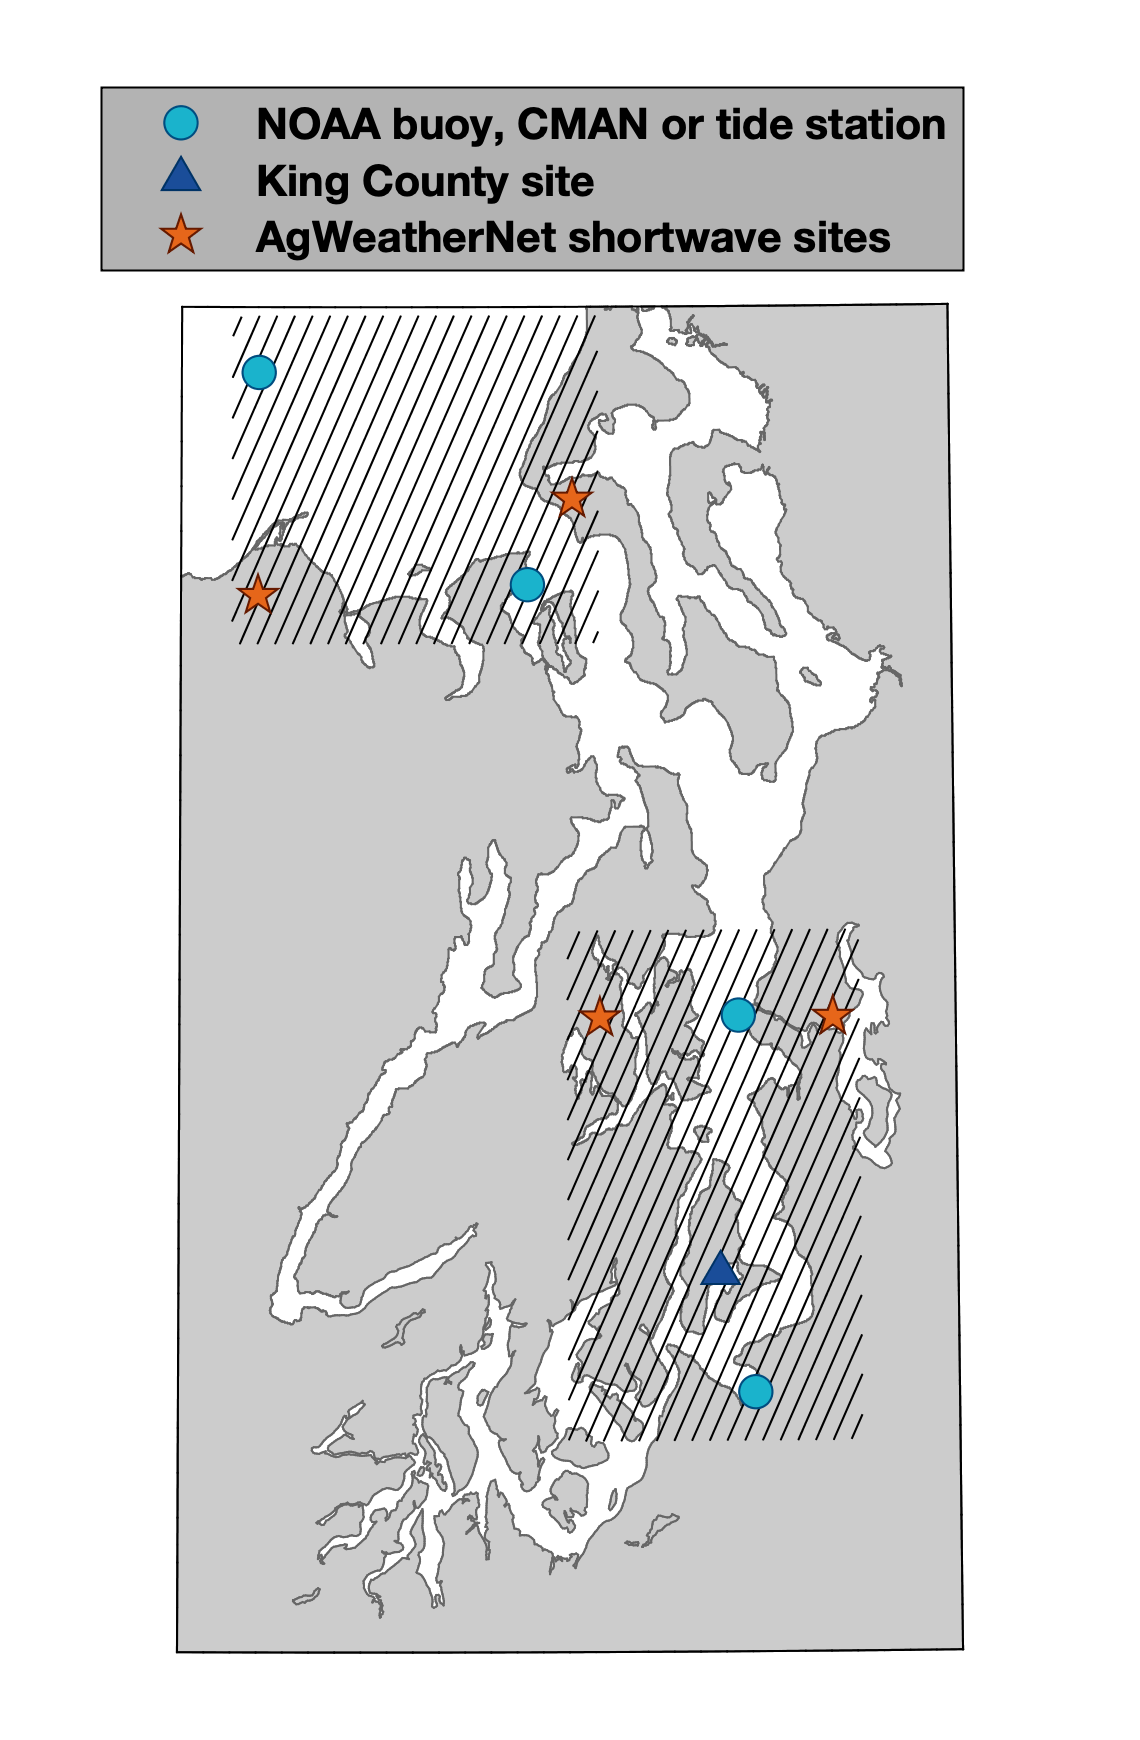
Map showing data sources for heat flux calculations with cross-hatching indicating the two general regions for the flux estimates, i.e. North Puget Sound and Central Puget Sound.