Forecast Origin Dates
J-SCOPE forecasts 2016 will be a warm year, though not as extreme as 2015. J-SCOPE forecast results for the simulation beginning in February of 2016 are shown in the first figure below. Each panel represents a two-month average for the region averaged over three model runs of the ensemble represented as an anomaly. The relative uncertainty from the ensemble for the same time period is also depicted.
One bias is known to exist in the model that impacts these forecasted SSTs. Short wave radiation, which is the solar energy that warms the ocean sea surface temperature and drives photosynthesis of phytoplankton in the system, is known to be too high (see 2013, Year in Review), which can contribute to forecast temperatures being too warm by about 2-3 degrees in summer. An important implication is that the evolution of the SST during the spring and summer from J-SCOPE, i.e., the amount of warming, is more meaningful than the absolute temperatures.
For waters off the Washington coast, the forecast projects that SST will be higher than climatology in all averaged time-periods (January - February, March - April, May - June, and July - August) for 2016. The relative uncertainty is highest right along the coast in March - April (10%), and decreases over the year.
For the waters off the Oregon coast, the forecast projects that SST will be warmer than the climatology over the entire forecast. Relative uncertainty is highest right along the coast and over Heceta Bank in May - June (10%), and remains high for the rest of the forecast.
The SST was forecast using all three model runs of the ensemble for two point locations where buoys exist, Ćháʔba· off La Push, WA, and NH-10 off Newport, OR, are shown at the bottom of the page.
Finally, climatological cross-sections from the Newport Line in Oregon, as well as the Grays Harbor Line in Washington, are compared to the forecasted average of the ensemble members. The forecast projects that the temperatures for the upwelling season of 2016 will be higher than the climatology and extend down to over 100 meters depth below the surface covering much of the shelf in both Washington and Oregon.
We note that the NANOOS Climatology App shows that the NDBC buoys along the WA and OR shelf are recording sea surface temperatures approximately two standard deviations above long-term averages since the start of 2015. The ability of the model to forecast this anomaly will be evaluated in our Year in Review activities.
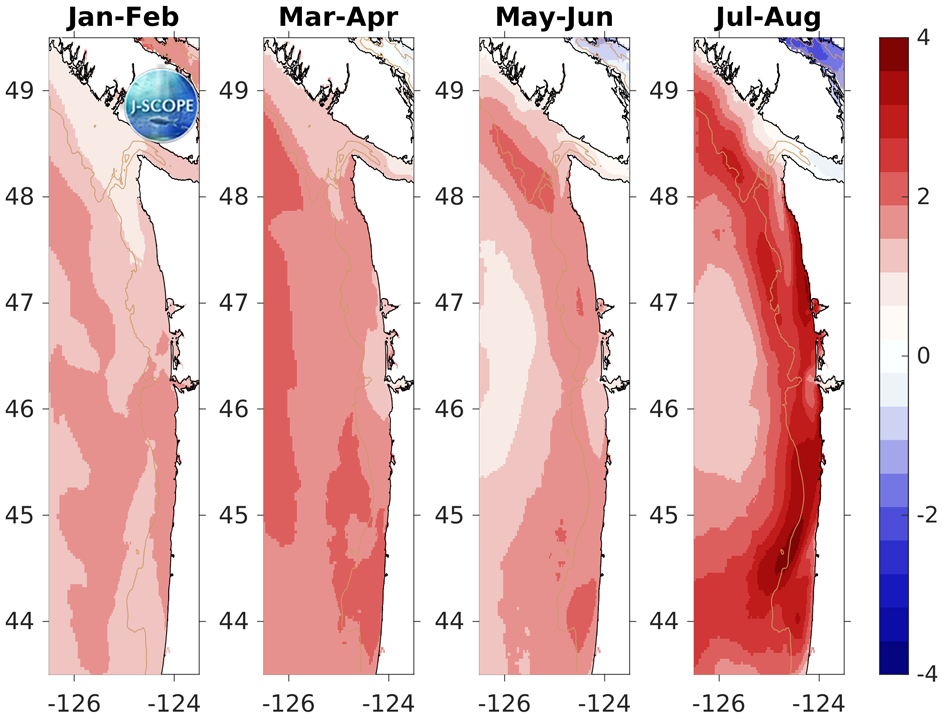
The modeled region SST averaged over all three ensemble model runs and in time for (from left to right) January - February, March - April, May - June, and July - August.
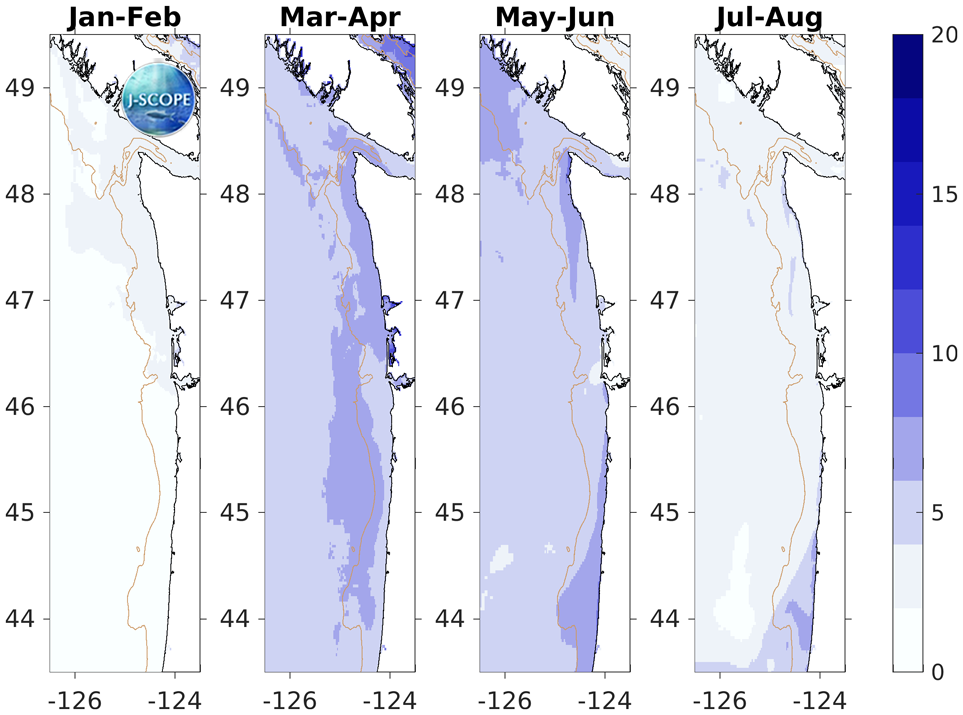
The relative uncertainty in percent for the modeled region SST values averaged in time for (from left to right) January - February, March - April, May - June, and July - August. The relative uncertainty is defined as the standard deviation of the ensemble divided by the mean of the ensemble and is reported as a percentage of the mean.
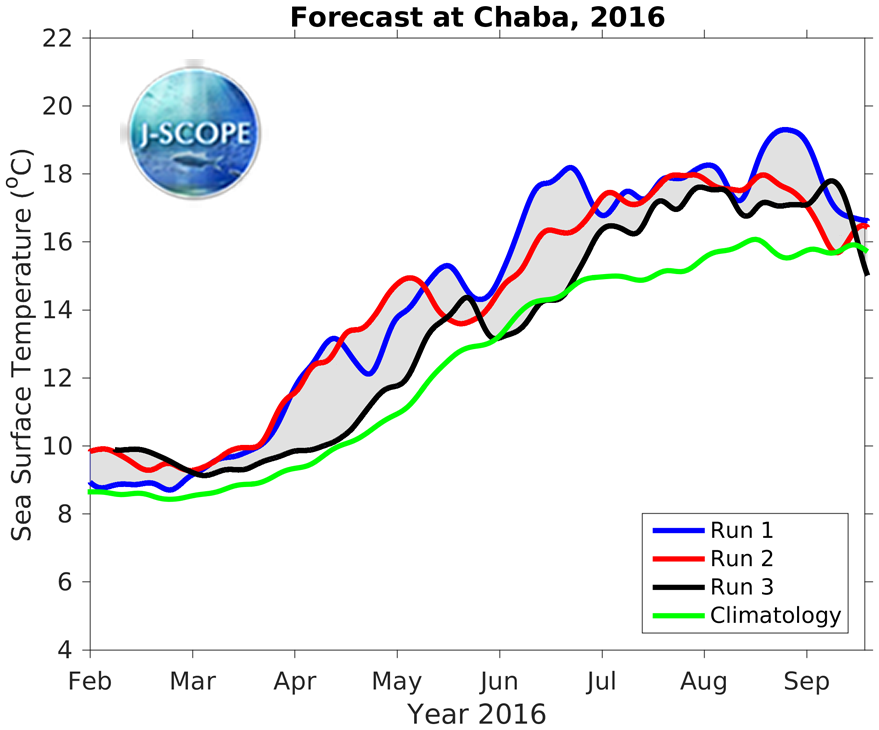
Time series for SST at Ćháʔba· (~48 N) for each of the three ensemble members.
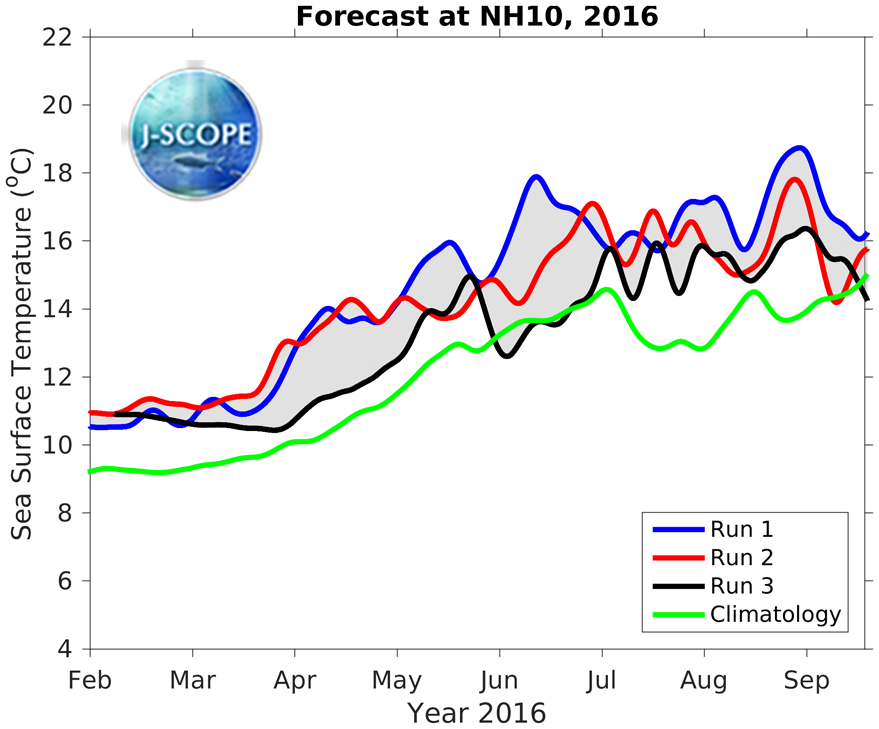
Time series for SST at NH-10 (~44.5 N) for each of the three ensemble members.
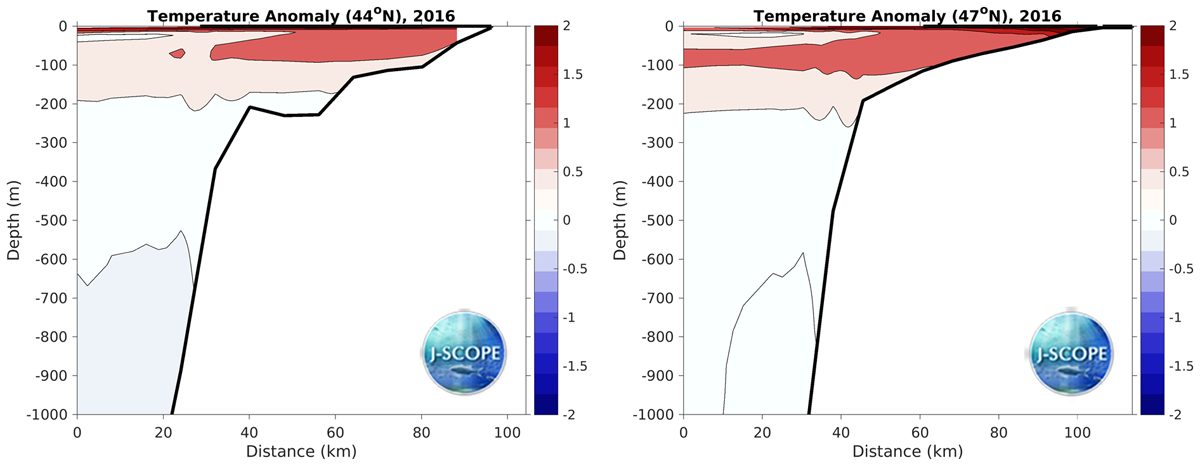
The modeled cross-section from the Newport Line (left) and the Grays Harbor Line (right), averaged over all three ensemble members, and averaged over the summer upwelling months.