Forecast Origin Dates
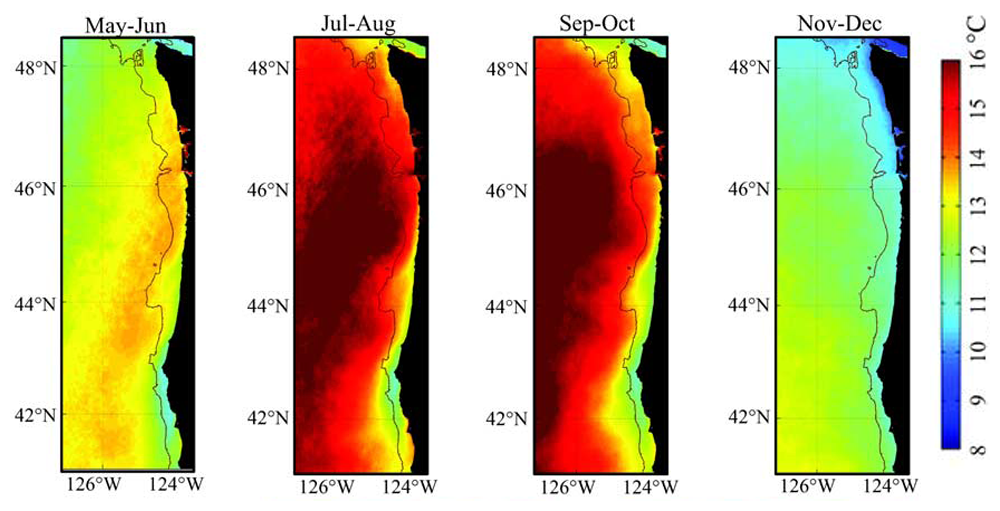
J-SCOPE forecast results for the simulation beginning in April of 2015 are shown in the first figure below. Each panel represents a two-month average for the region averaged over three model runs of the ensemble. The regional climatology from Venegas et al, 2008 is provided directly below the forecast plots for reference, although it covers a slightly larger area than the modeled domain. The panels directly under the climatology depict the relative uncertainty from the ensemble for the same time period.
One main bias exists in the model that impacts these forecasted SSTs. The short wave radiation is known to be biased high (see 2013, Year in Review), which can contribute to forecast temperatures being too warm by about 2-3 degrees in summer. An important implication is that the evolution of the SST during the spring and summer from J-SCOPE, i.e., the amount of warming, is more meaningful than the absolute temperatures.
For the modeled region, the forecast projects that SST will be warmer than climatology in most of the averaged time-periods (May - June, July - August, and September - October) for 2015. The forecasted SSTs are near average for the fall of 2015 (November - December). The relative uncertainty is highest on the shelf in July - August (5%). Relative uncertainty is low (~5 - 7%) in general for the forecasted time periods. The model indicates a lack of cooler water in the immediate vicinity of the coast in the forecast for July - August. This is apparently due to the forecast of relatively weak upwelling-favorable winds during the middle of summer in combination with known positive biases in temperatures of the near-bottom water at the coast subject to upwelling.
The SST was forecast using all three model runs of the ensemble for two point locations where buoys exist, Ćháʔba· off La Push, WA, and NH-10 off Newport, OR, are shown at the bottom of the page. The three runs experience the biggest forecasted difference in August at Ćháʔba· and in July and August at NH-10.
We note that the NVS Climatology App shows that the NDBC buoys along the WA and OR shelf are recording sea surface temperatures approximately one standard deviations above long-term averages since the start of the 2015 upwelling season.
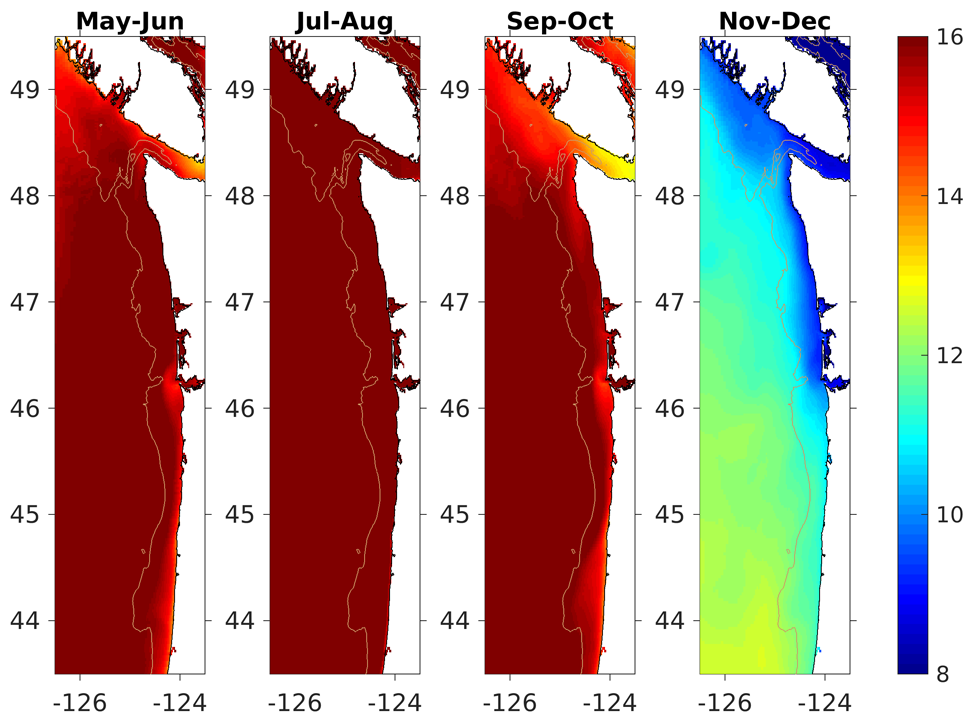
The modeled region SST averaged over all three ensemble model runs and in time for (from left to right) May - June, July - August, September - October, and November - December.
The regional climatology from Venegas et al, 2008 is provided above, although it covers a slightly larger area than the modeled domain, and has a slightly different color scale.
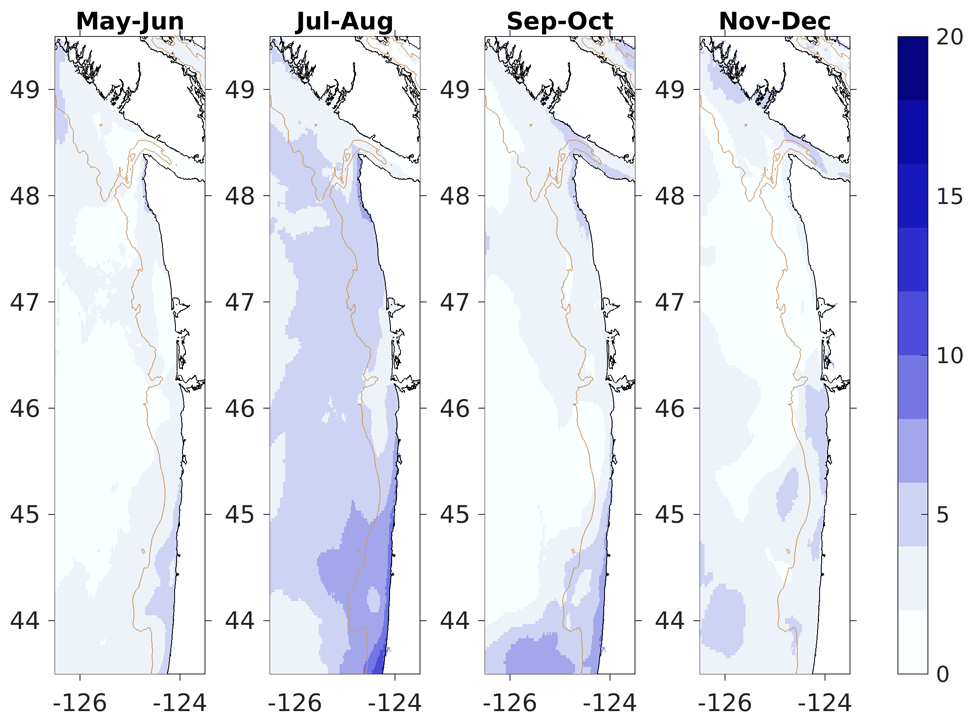
The relative uncertainty in percent for the modeled region SST values averaged in time for (from left to right) May - June, July - August, September - October, and November - December. The relative uncertainty is defined as the standard deviation of the ensemble divided by the mean of the ensemble and is reported as a percentage of the mean.
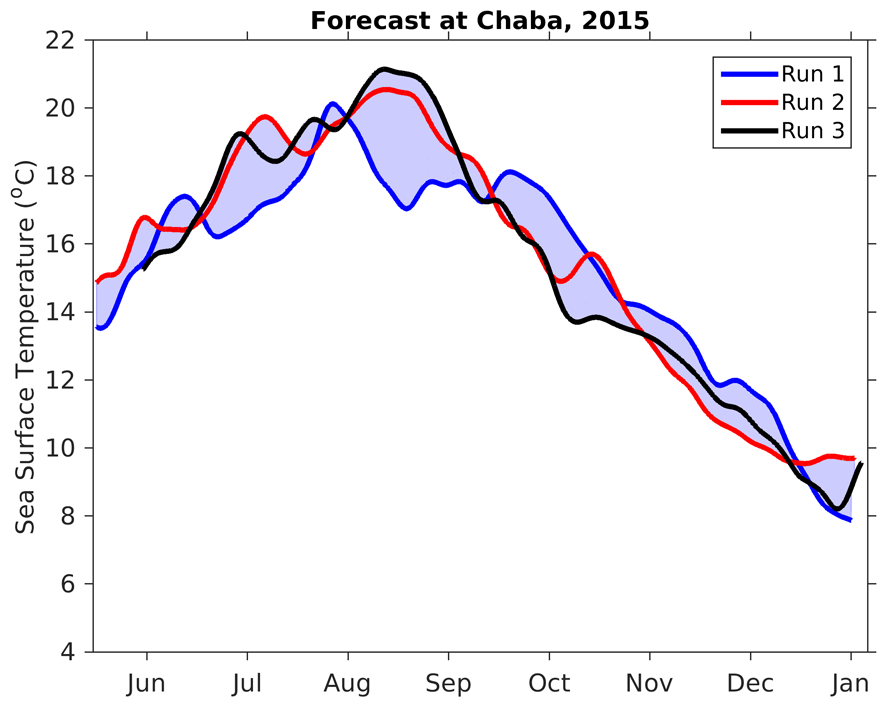
Time series for SST at Ćháʔba· (~48 N) for each of the three ensemble members.
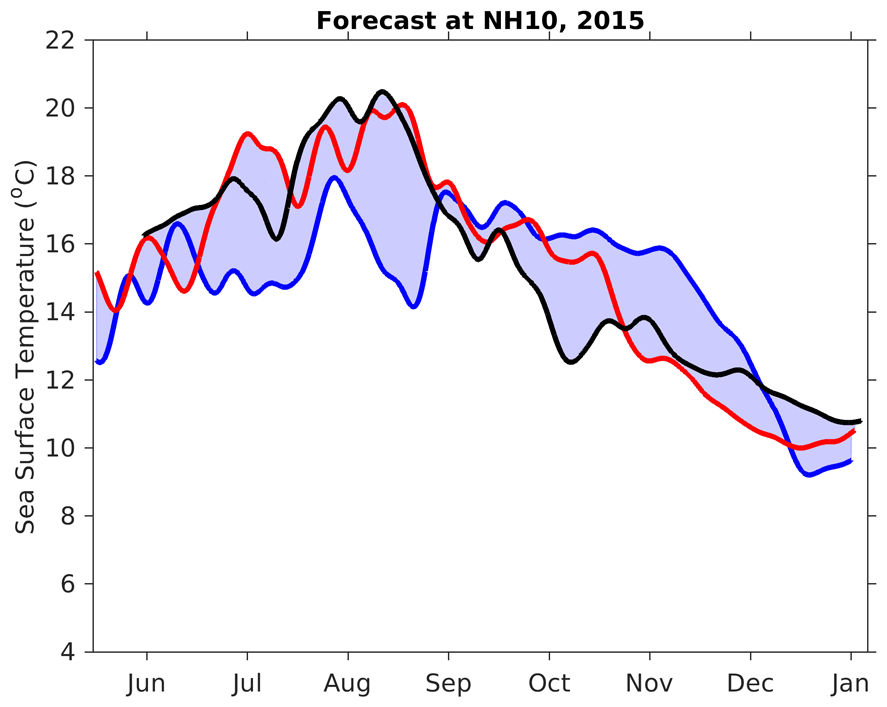
Time series for SST at NH-10 (~44.5 N) for each of the three ensemble members.