Forecast Origin Dates
J-SCOPE forecast results for the model run beginning in February of 2016 are shown in the first figure. Each panel represents ensemble averaged anomalies of two month averages for the region. The relative uncertainty from the ensemble for the same time period is also depicted.
For waters off the Washington coast, the forecast projects that 10-meter integrated Chlorophyll will be lower than climatology in most averaged time-periods (January - February, March - April, May - June) for 2016. The forecast projects the 10-meter integrated Chlorophyll to be higher than the climatology in the end of the summer averaged time-periods (July - August) in the region associated with the Juan de Fuca eddy and around the mouth of the Columbia River for 2016. The relative uncertainty is highest right along the coast in May - June (40%), and decreases over the remainder of the forecast.
For the waters off the Oregon coast, a slightly different pattern is seen. The forecast projects that 10-meter integrated Chlorophyll will be higher than the climatology during all time-average periods (January - February, March - April, May - June, July - August) for 2016 right along the coast and on Heceta Bank, but lower than the climatology on the outer shelf and in northern Oregon. Relative uncertainty is highest right along the coast and over Heceta Bank in May - June (40%), and for everywhere except for Heceta Bank, the uncertainty decreases over the rest of the forecast.
The high uncertainty in May - June is caused by the uncertainty surrounding the onset of the spring transition in this year. The three ensemble members don’t agree, see California Current Indicators.
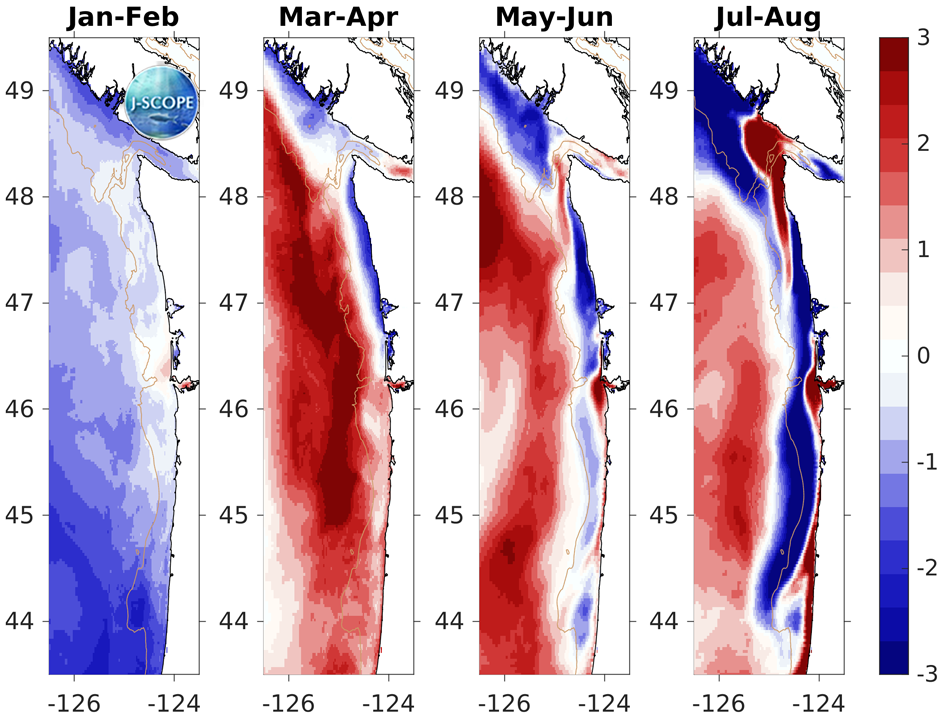
The modeled region chlorophyll values integrated over the surface 10 meters (in mg/l), and averaged over all three ensemble members and in time for (from left to right) January - February, March - April, May - June, and July - August.
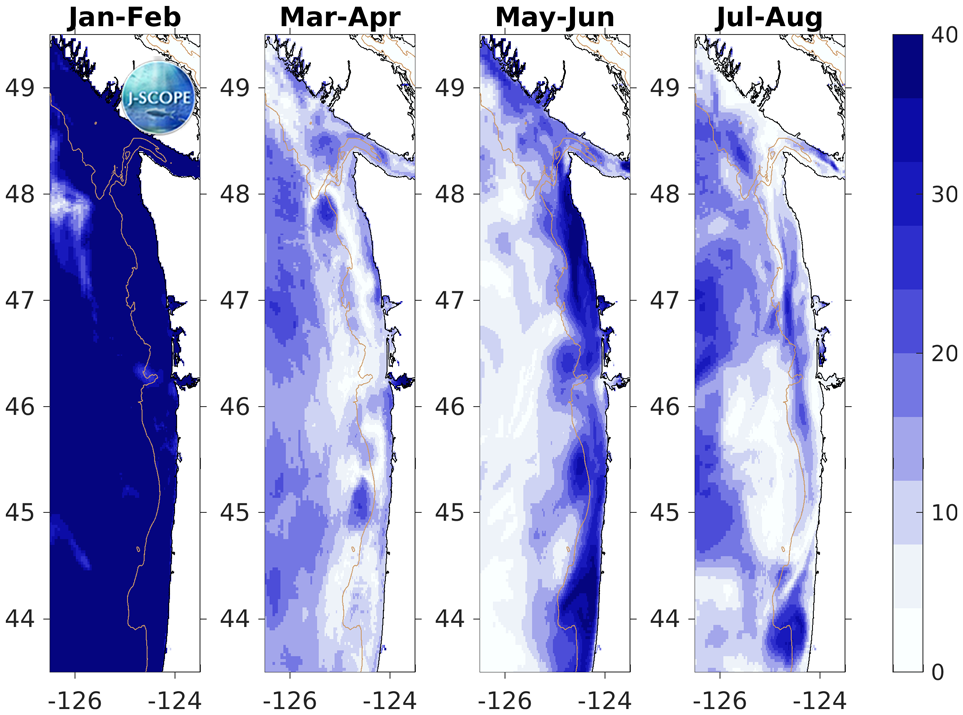
The relative uncertainty in percent for the modeled region chlorophyll values integrated over the surface 10 meters, and averaged in time for (from left to right) January - February, March - April, May - June, and July - August. The relative uncertainty is defined as the standard deviation of the ensemble divided by the mean of the ensemble and is reported as a percentage of the mean.