Forecast Origin Dates
J-SCOPE forecast results for the simulation beginning in April of 2020 are shown through a series of figures below. In the first figure, each panel represents ensemble averaged anomalies of two month averages for the region. In the second figure, the panels depict the relative uncertainty from the ensemble for the same time periods.
From the maps, oxygen on the shelf is forecast to be lower than the climatology during the upwelling season of 2020 in Washington and Oregon. The relative uncertainty is low (<20%) for the first half of the upwelling season (May - June) but increases on the shelf (up to ~50%) during the second half of the upwelling season (July - August) and remains high in the fall.
Forecast bottom oxygen (mg/l), averaged over three ensemble members for each month, indicates declines in oxygen concentrations over the forecast for both Washington and Oregon, with hypoxia (O2 < 2 mg/l) present around the shelf break over much of the Oregon coast in June and expanding to cover the majority of the Washington shelf by July. The region north of Ćháʔba· remains normoxic. These hypoxic conditions persist on the continental shelf through September when the northernmost region of the Washington shelf becomes hypoxic as well.
Over the course of the upwelling season, hypoxia extends upward into the water column as well. The percentage of the water column that is forecast to experience hypoxia (O2 < 2 mg/l) is a metric for this phenomenon. Early in the upwelling season (May - June), hypoxia is forecasted for the Oregon shelf waters, mainly near Heceta Bank where up to 20% of the water column is forecasted to be hypoxic. In July, hypoxia is forecast to intensify over most of Heceta Bank (<40%) and begins to occur at low percentages of the water column throughout much of the Oregon and Washington shelf (<20%). By late summer (August and September), the percentage of the water column that is hypoxic increases coast-wide, with particularly high hypoxic volumes forecast on the Oregon shelf (~50%) and along the 50 m isobath in Washington (~40%).
Time series of bottom oxygen from the Washington coast near one of the Olympic Coast National Marine Sanctuary (OCNMS) moorings at Cape Elizabeth (site CE042), from NH-10 mooring off of Newport, Oregon, and from the Ćháʔba· mooring off of La Push, Washington, are shown for each member of the ensemble. The model forecasts that hypoxia will most likely develop at all three moorings. For the NH-10 and CE042 moorings, two of the three ensemble members suggest hypoxia onset earlier than climatology, likely beginning in June. Another time series from the outer Washington shelf, Ćháʔba·, forecasts hypoxia onset in August but this is highly uncertain for this location given the wide spread in the ensemble members.
Finally, climatological cross-sections from the Newport Line in Oregon (44°N) and the Grays Harbor Line in Washington (47°N) are compared to the forecast average of the ensemble members during the summer upwelling season (May - August). In both Oregon and Washington, the forecast projects that the oxygen concentration for the upwelling season of 2020 will be much lower than the climatology on both the shelf and at deeper depths, with the largest anomalies occurring between the surface and ~300 m depth in both Oregon and Washington.
The emergence of anoxia in the model in late summer is caused by a bias associated with the lack of relaxations in the winds (found to be important in a paper by Adams et al, 2013) in the Climate Forecast System input files as well as a bias in the shortwave radiation (see 2013, Year in Review). The model does have skill in predicting the emergence and severity of hypoxia, while it is biased low for these reasons. Given the difficulty in predicting the fall transition in prior forecasts (see 2013, Year in Review), the forecast for low oxygen levels forecast well into August is highly uncertain.
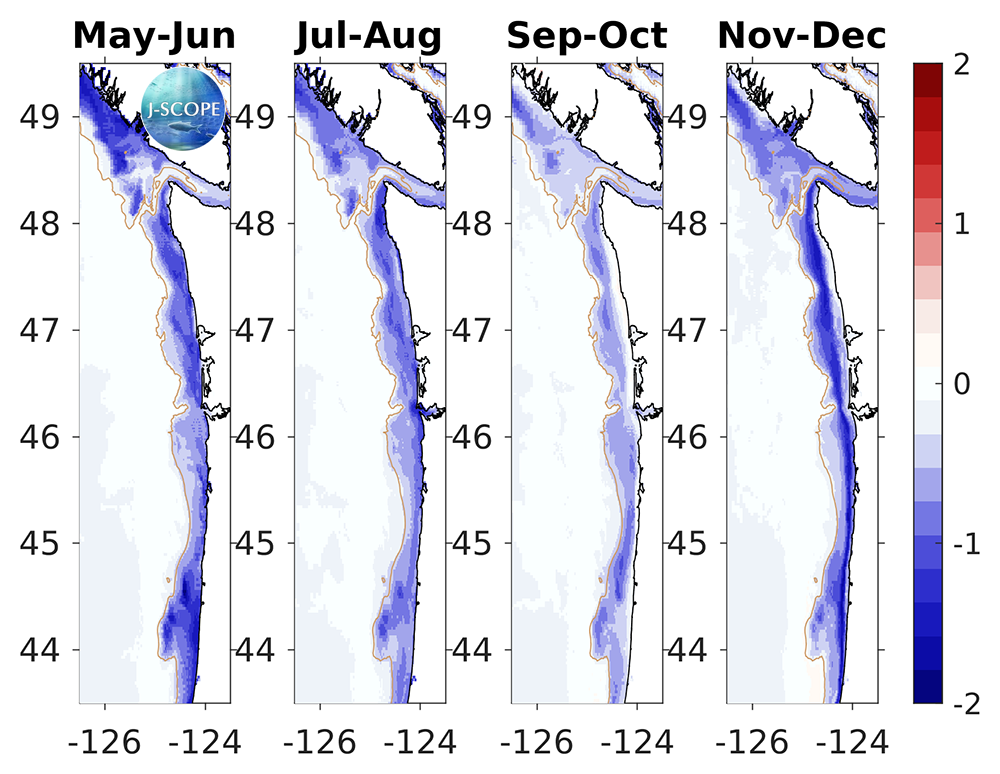
The modeled region bottom oxygen (ml/l) anomaly averaged over all three ensemble members and in time for (from left to right) May - June, July - August, September - October, November - December.
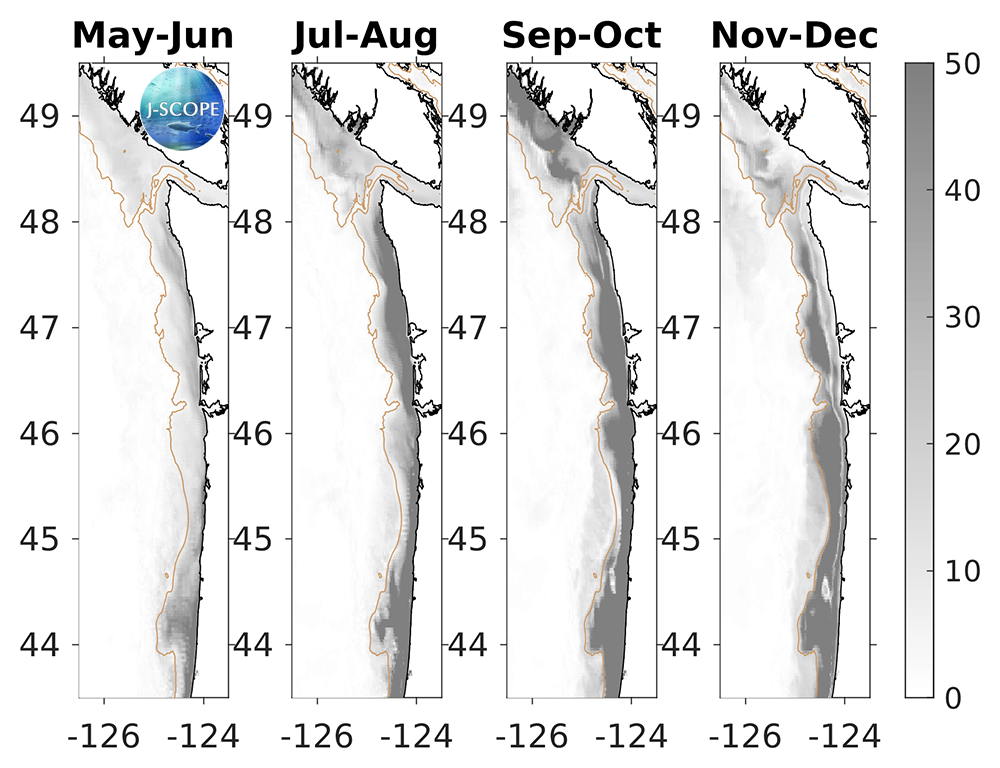
The relative uncertainty in percent for the modeled region bottom oxygen values averaged in time for (from left to right) May - June, July - August, September - October, November - December. The relative uncertainty is defined as the standard deviation of the ensemble divided by the mean of the ensemble and is reported as a percentage of the mean.
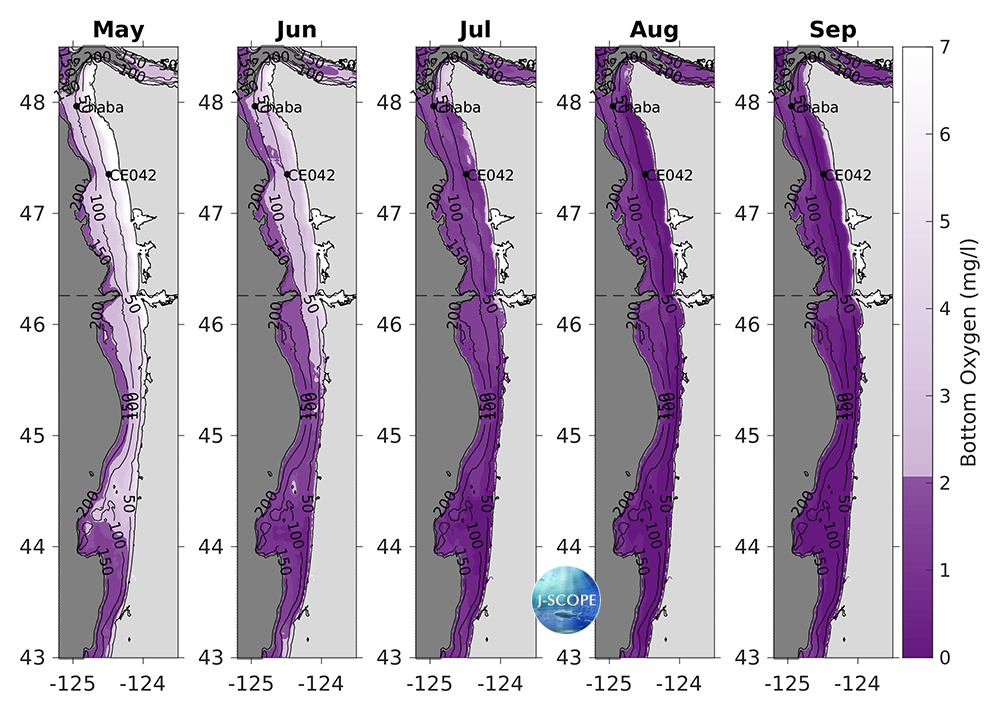
The modeled region bottom oxygen (mg/l) averaged over all three ensemble members and in time for (from left to right) May, June, July, August, and September. Hypoxia (O2 < 2 mg/l) is shown in dark purple, land is shaded light grey, and offshore areas are shaded dark gray. The black dashed line indicates the boundary between Washington and Oregon waters. Black contours indicate bathymetry on the shelf. Two mooring locations are plotted for reference (Ćháʔba·, CE042).
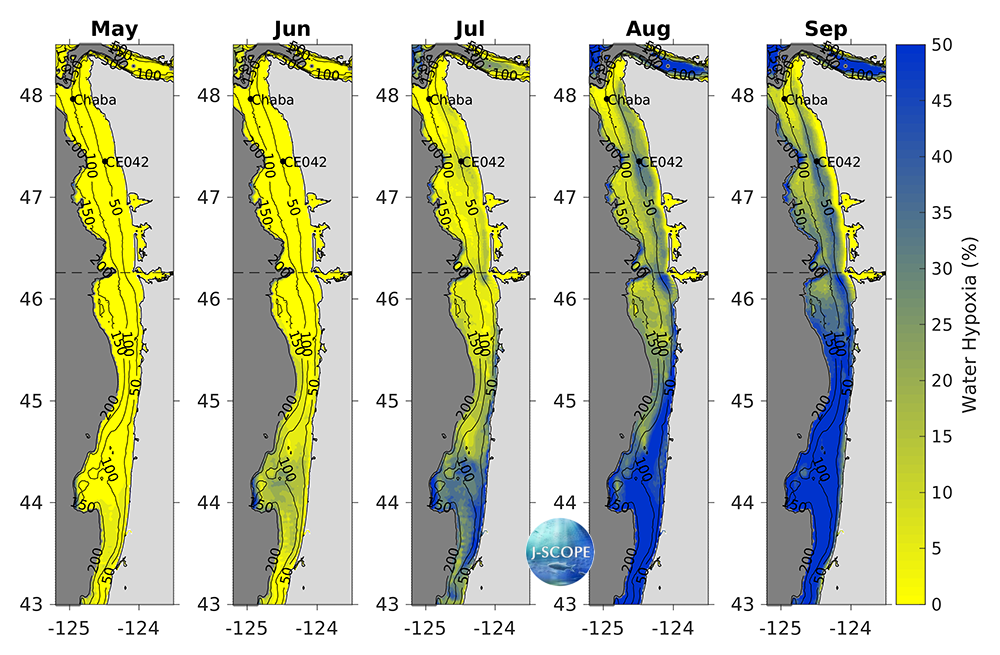
The modeled region water column hypoxia (%) averaged over all three ensemble members and in time for (from left to right) May, June, July, August, and September. Land is shaded light grey, and offshore areas are shaded dark gray. The black dashed line indicates the boundary between Washington and Oregon waters. Black contours indicate bathymetry on the shelf. Two mooring locations are plotted for reference (Ćháʔba·, CE042).
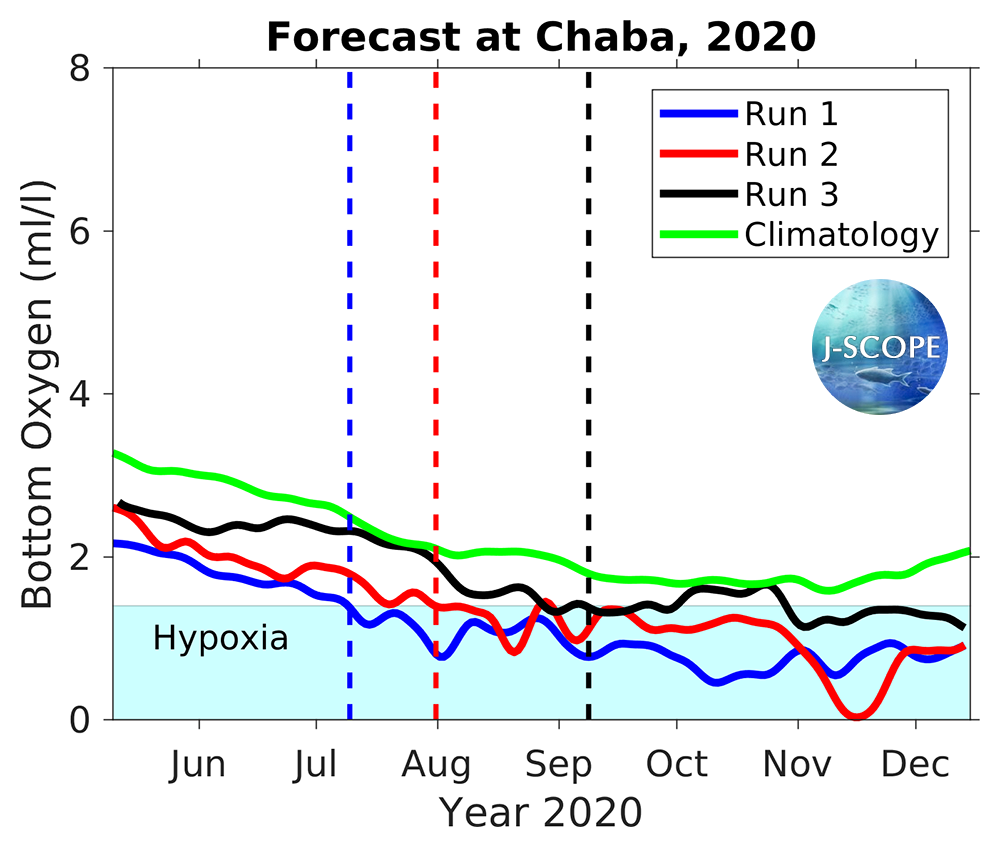
Time series for bottom oxygen at the Ćháʔba· mooring (~48°N) for each of the three ensemble members. Hypoxia is outlined by the blue region on the plot. The timing of each run’s onset of hypoxic conditions for more than 8 days is identified by the vertical dotted lines.
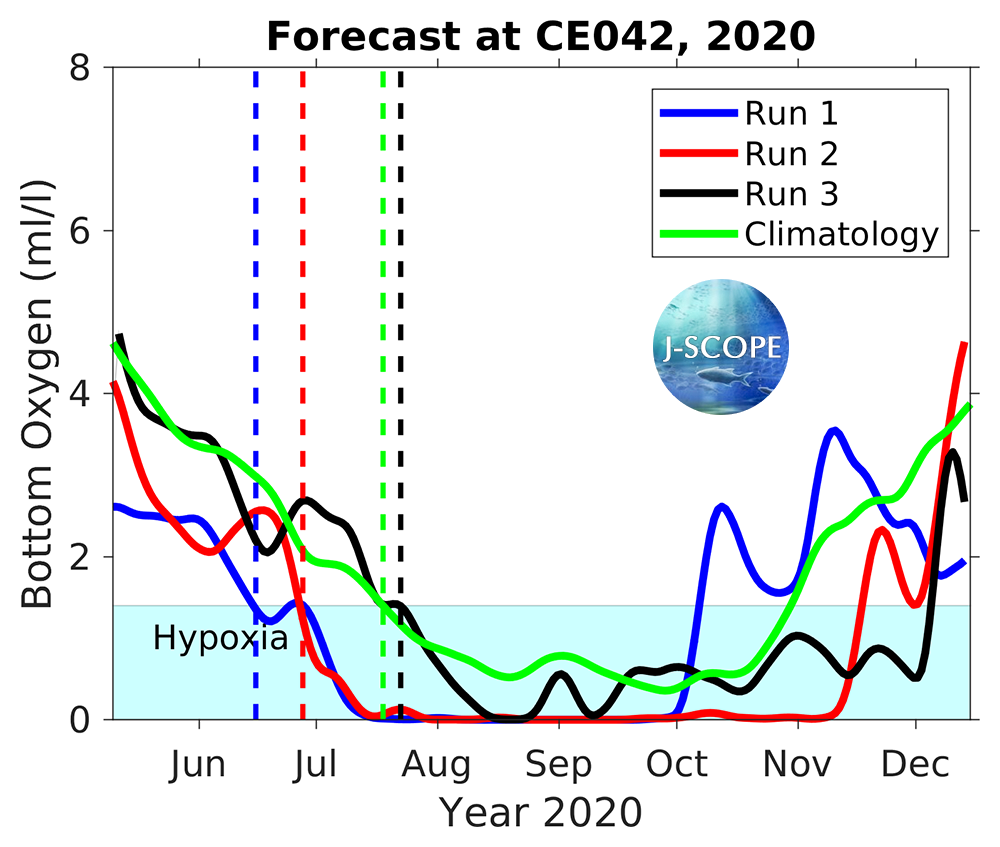
Time series for bottom oxygen at one of the Olympic Coast National Marine Sanctuary Moorings (CE042, ~47.5°N) for each of the 3 ensemble members. Hypoxia is outlined by the blue region on the plot. The timing of each run’s onset of hypoxic conditions for more than 8 days is identified by the vertical dotted lines, with the green line indicating the climatological timing.
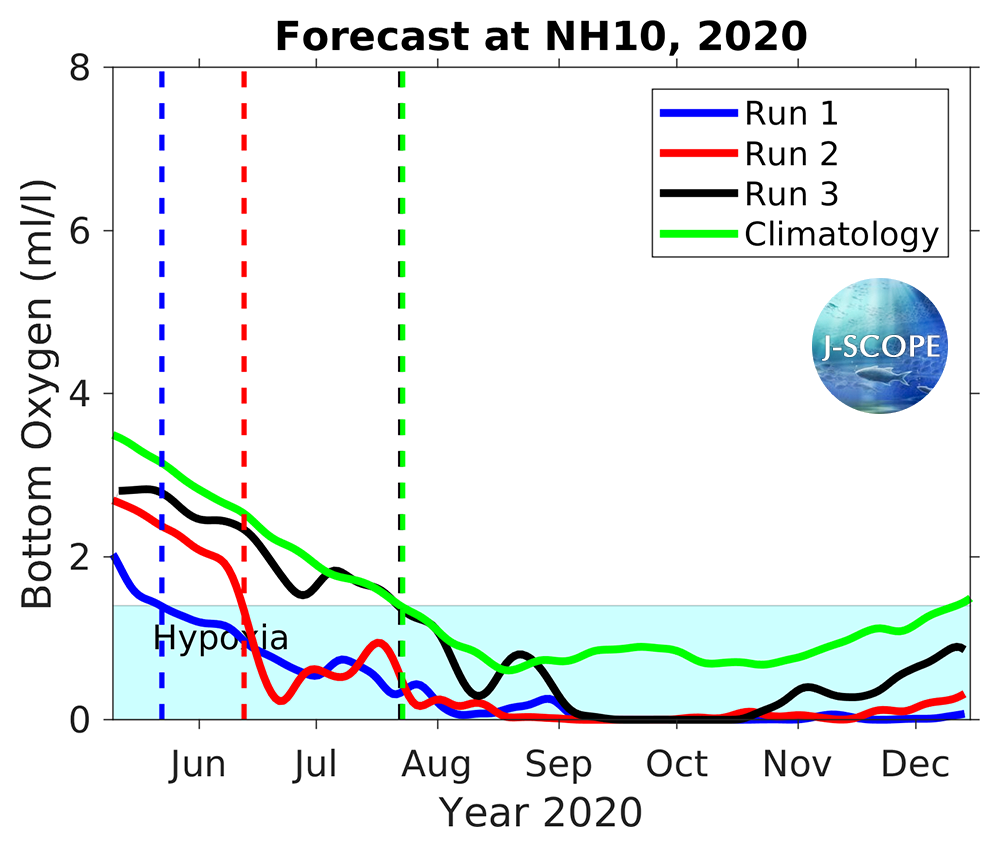
Time series for bottom oxygen at the NH-10 mooring in Oregon (~45°N) for each of the three ensemble members. Hypoxia is outlined by the blue region on the plot. The timing of each run’s onset of hypoxic conditions for more than 8 days is identified by the vertical dotted lines, with the green line indicating the climatological timing.
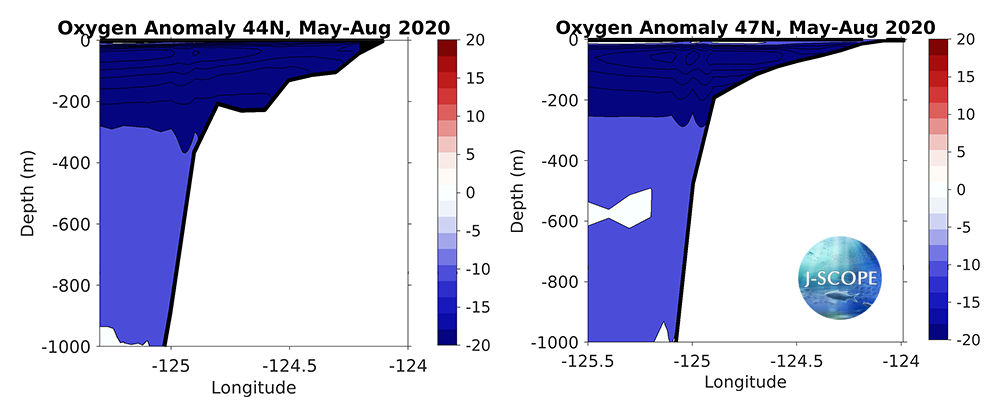
The modeled cross-section from the Newport Line off Oregon (left, 44°N) and the Grays Harbor Line off Washington (right, 47°N), averaged over all three ensemble members, and averaged over the summer upwelling months (May - August).