Forecast Origin Dates
J-SCOPE forecast results for the model run beginning in January of 2023 are shown in the first figure. Each panel represents ensemble averaged anomalies of two month averages for the region. The panels directly under the anomaly plots depict the relative uncertainty from the ensemble for the same time periods.
For waters off the Washington coast, the forecast projects that 10-meter integrated chlorophyll will be slightly higher than climatology over most of the upwelling season (May-Aug) with the Juan de Fuca Eddy region experiencing a high in the later portion of the upwelling season (July -August). For waters off the Oregon coast, the forecast projects that 10-meter integrated chlorophyll will be slightly lower than climatology on the shelf and higher than climatological farther offshore at the beginning of the upwelling season (May - June). The relative uncertainty is highest at the beginning of the forecast when chlorophyll levels are low, but then decreases and remains relatively steady throughout the upwelling season.
The uncertainty is caused by the differences between the three ensemble members wind forcing, see California Current Indicators.
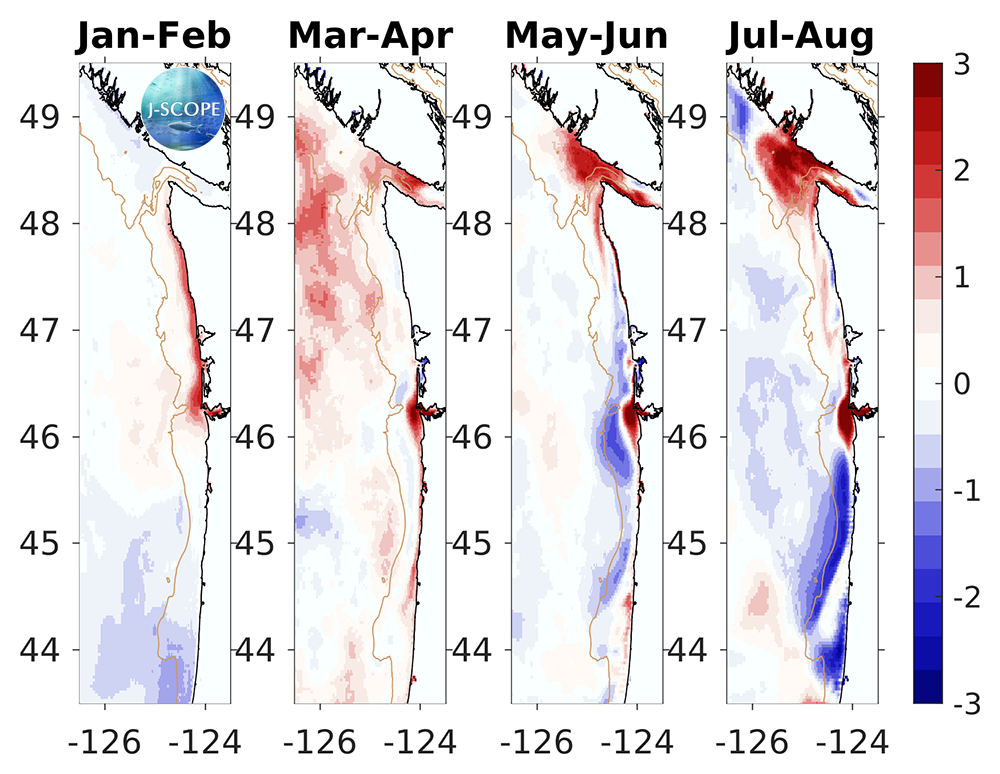
The anomaly of the modeled region chlorophyll values integrated over the surface 10 meters (in mg/l), and averaged over all three ensemble members and in time for (from left to right) January - February, March - April, May - June, July - August.
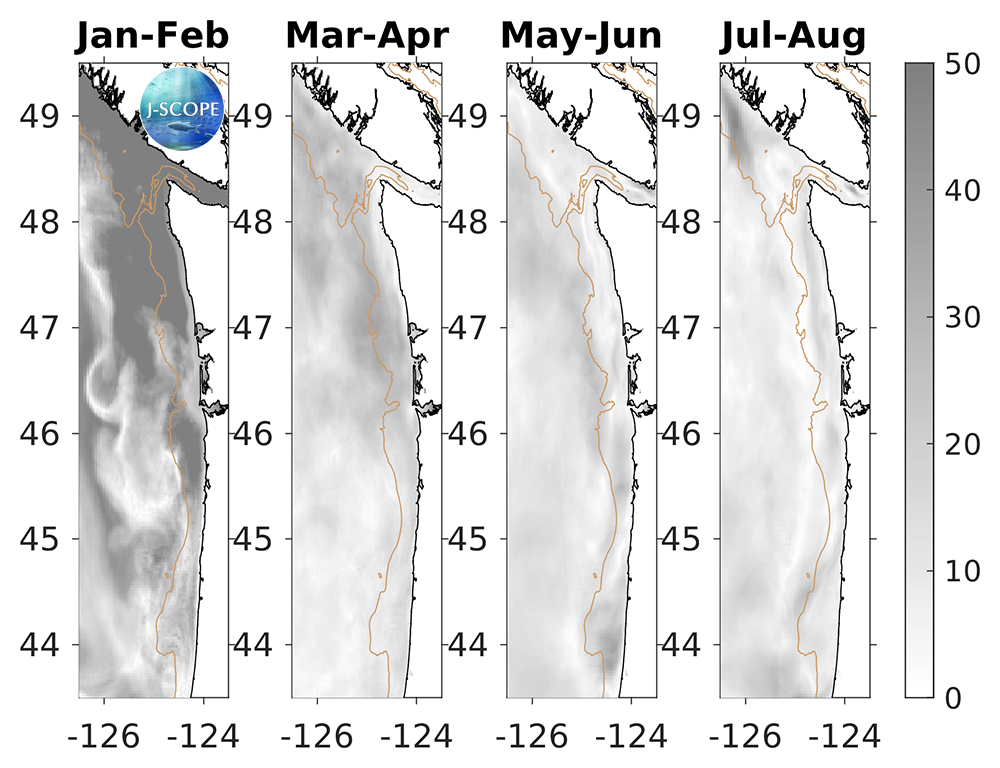
The relative uncertainty in percent for the modeled region chlorophyll values integrated over the surface 10 meters (in mg/l), and averaged in time for (from left to right) January - February, March - April, May - June, July - August. The relative uncertainty is defined as the standard deviation of the ensemble divided by the mean of the ensemble and is reported as a percentage of the mean.