Forecast Origin Dates
J-SCOPE forecast results for the model run beginning in April of 2021 are shown in the first figure. Each panel represents ensemble averaged anomalies of two month averages for the region. The panels directly under the anomaly plots depict the relative uncertainty from the ensemble for the same time periods.
The forecast projects that 10-meter integrated chlorophyll for the early upwelling season (May - June) will exhibit a high degree of spatial variability, but overall it will be higher than climatology in Washington and Oregon offshore waters and southern Oregon shelf waters near Heceta Bank, and near climatology in shelf waters in Washington and northern Oregon. Additionally, there are patches of higher than climatology chlorophyll at the mouth of the Columbia River. Later in the upwelling season (July - August), stretches of higher than climatology chlorophyll persist and strengthen in coastal waters in southern Washington and throughout the Oregon coast, while shelf waters in Washington and northern Oregon are remain near climatology; offshore waters approach climatological conditions. The relative uncertainty is typically low (<20%) over the upwelling season, though there are patches of higher uncertainty near Heceta Bank in Oregon especially later in the season (July - August).
The uncertainty is caused by the differences between the three ensemble members. One way of looking at the physical differences in the models is to see the spread in the wind forcing, see California Current Indicators. The ensemble members disagree the most in the beginning of the forecast and the fall.
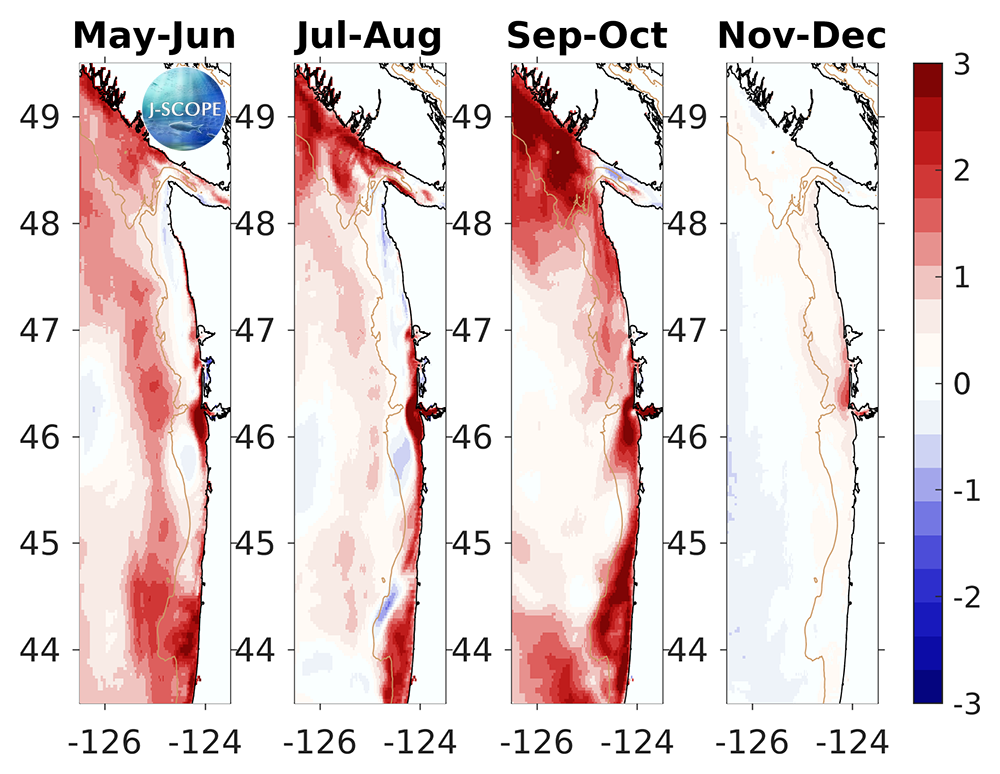
The anomaly of the modeled region chlorophyll values integrated over the surface 10 meters (in mg/l), and averaged over all three ensemble members and in time for (from left to right) May - June, July - August, September - October, November - December.
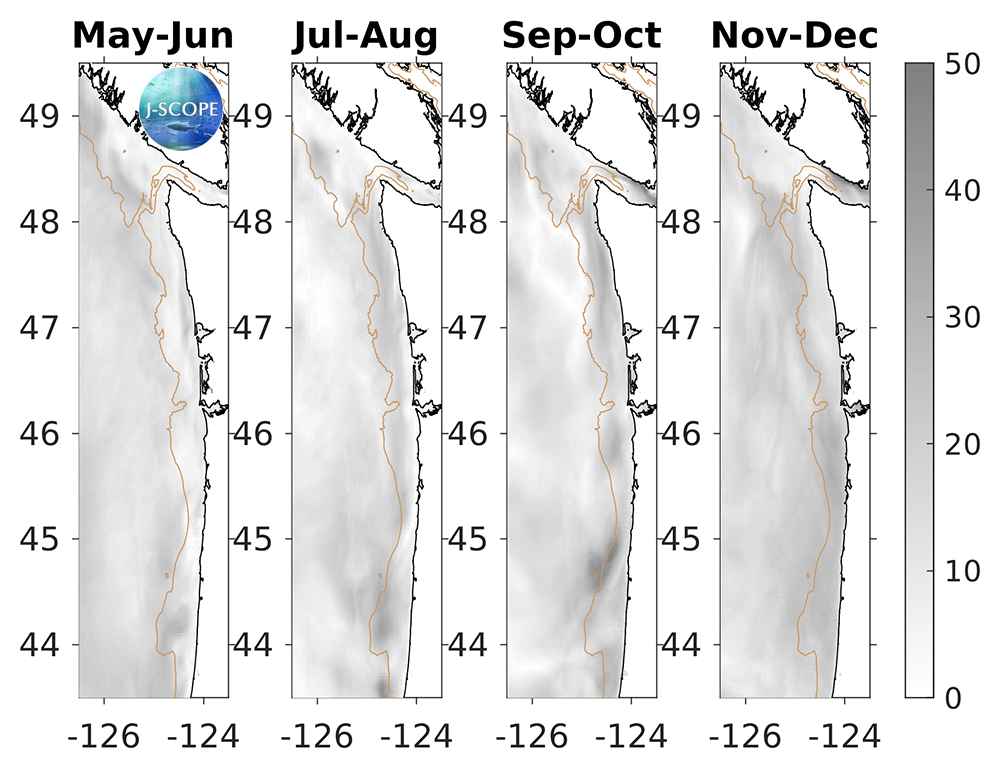
The relative uncertainty in percent for the modeled region chlorophyll values integrated over the surface 10 meters, and averaged in time for (from left to right) May - June, July - August, September - October, November - December. The relative uncertainty is defined as the standard deviation of the ensemble divided by the mean of the ensemble and is reported as a percentage of the mean.