Forecast Origin Dates
J-SCOPE forecast results for the model run beginning in February of 2015 are shown in the first figure. Each panel represents a two month average for the region, averaged over all three model runs of the ensemble. The regional climatology from Venegas et al, 2008 is provided just below for reference, although it covers a slightly larger area than the modeled domain, and has a slightly different color scale.
For waters off the Washington coast, the forecast projects that 10-meter integrated Chlorophyll will be lower than climatology in most averaged time-periods (January – February, March – April, May – June) for 2015. The forecast projects the 10-meter integrated Chlorophyll to be higher than the climatology in the end of the summer averaged time-periods (July – August) for 2015. The relative uncertainty is highest right along the coast in March – April (30%), and decreases over the year.
For the waters off the Oregon coast, a slightly different pattern is seen. The forecast projects that 10-meter integrated Chlorophyll will be higher than the climatology during all time-average periods (January – February, March – April, May – June, July – August) for 2015. Relative uncertainty follows the same pattern as in Washington, but with lower values in general.
Similar to 2013 (see 2013, Year in Review), the bloom is forecasted to be closer to the coast.
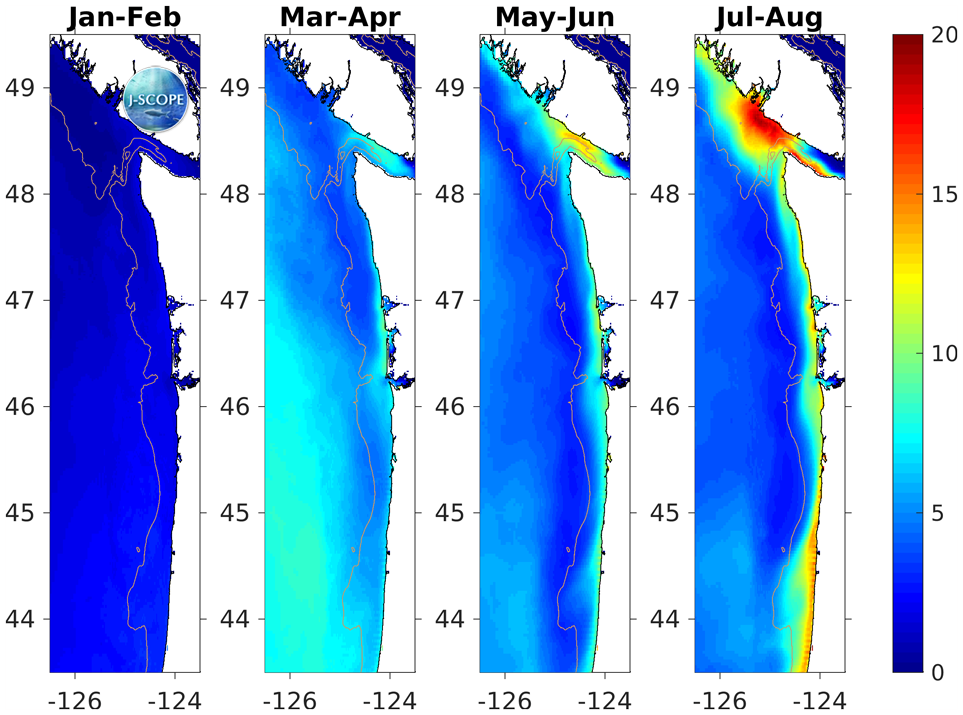
The modeled region chlorophyll values integrated over the surface 10 meters (in mg/l), and averaged over all three ensemble members and in time for (from left to right) January – February, March – April, May – June, and July – August.
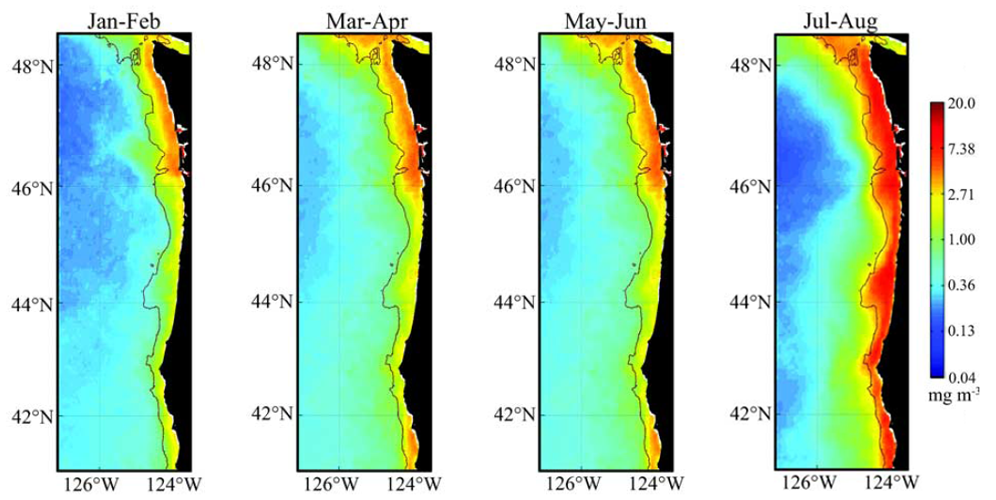
The regional climatology from Venegas et al, 2008 is provided on the right for reference, although it covers a slightly larger area than the modeled domain, and has a slightly different color scale.
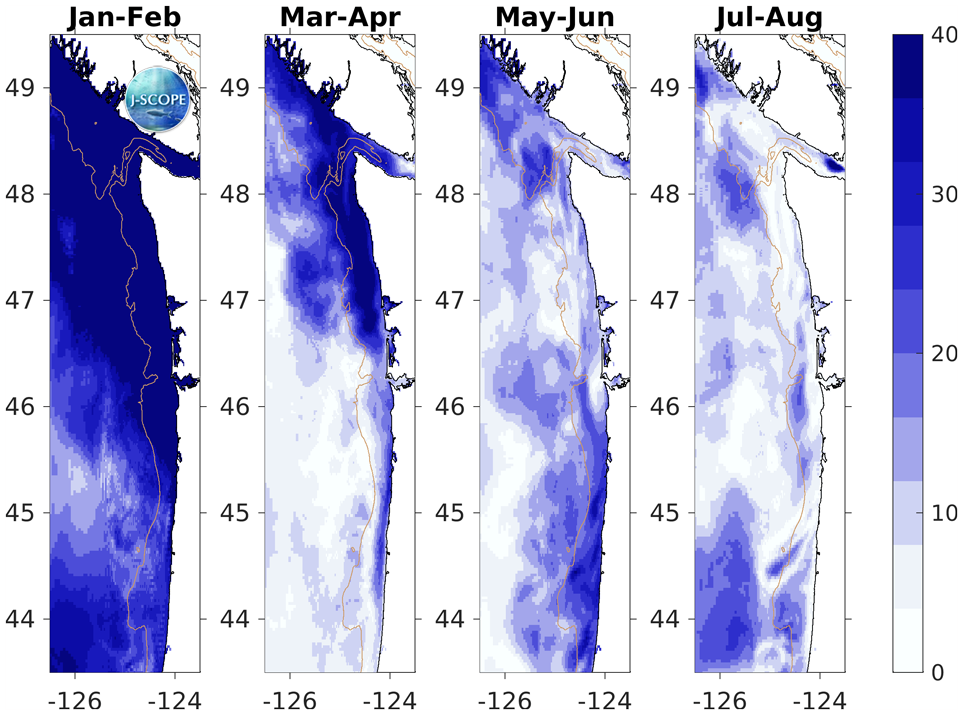
The relative uncertainty in percent for the modeled region chlorophyll values integrated over the surface 10 meters, and averaged in time for (from left to right) January – February, March – April, May – June, and July – August. The relative uncertainty is defined as the standard deviation of the ensemble divided by the mean of the ensemble and is reported as a percentage of the mean.