Forecast Origin Dates
J-SCOPE forecast results for the simulation beginning in February of 2015 are shown in the first figure below. Each panel represents a two-month average for the region averaged over three model runs of the ensemble . January through April has a different color bar than May through August. The regional climatology from Venegas et al, 2008 is provided directly below the forecast plots for reference, although it covers a slightly larger area than the modeled domain. The panels directly under the climatology depict the relative uncertainty from the ensemble for the same time period.
One bias is known to exist in the model that impacts these forecasted SSTs. The short wave bias is known to be too high (see 2014, Year in Review (see 2013, Year in Review), which can contribute to forecast temperatures being too warm in summer.
For waters off the Washington coast, the forecast projects that SST will be higher than climatology in all averaged time-periods (January - February, March - Aprril, May - June, and July - August) for 2015. From the seasonal warming perspective, the model is indicating a typical amount of warming of roughly 7°C. The relative uncertainty is highest right along the coast in January - February (20%), and more widespread throughout the domain but less in March - April (12%). Relative uncertainty during the summer months (May - August) is much lower (~5%) than for the other periods.
For the waters off the Oregon coast, a slightly different pattern is seen. The forecast projects that SST will be warmer than the climatology over the entire forecast. Relative uncertainty follows the same pattern as in Washington, but with lower values in general.
The SST was forecast using all three model runs of the ensemble for two point locations where buoys exist, Ćháʔba· off La Push, WA, and NH-10 off Newport, OR, are shown at the bottom of the page.
We note that the NVS Climatology App shows that the NDBC buoys along the WA and OR shelf are recording sea surface temperatures approximately two standard deviations above long-term averages since the start of 2015. The ability of the model to forecast this anomaly will be evaluated in our Year in Review activities.
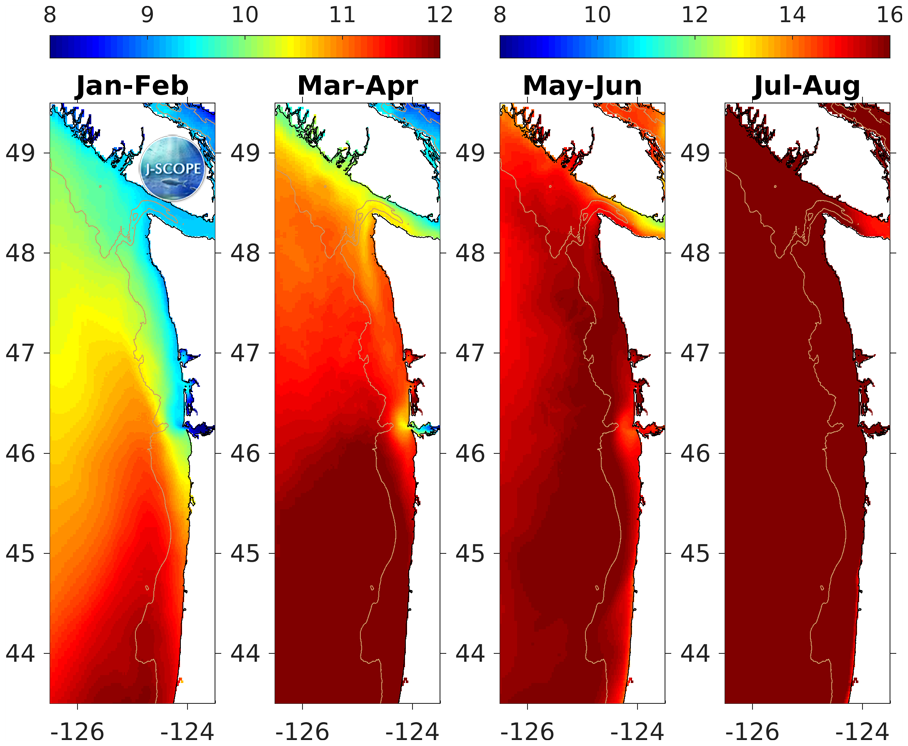
The modeled region SST averaged over all three ensemble members and in time for (from left to right) January – February, March – April, May – June, and July – August. Note the different color bars for January – April and May – August.
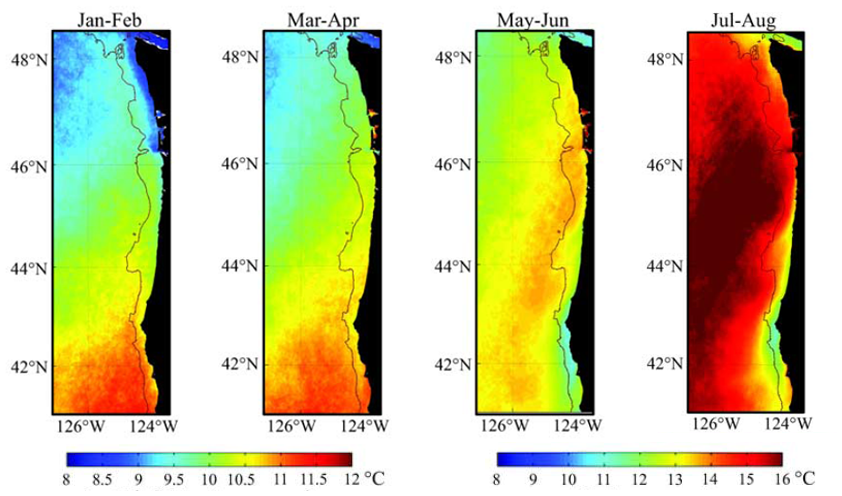
The regional climatology from Venegas et al, 2008 is provided on the right for reference, although it covers a slightly larger area than the modeled domain, and has a slightly different color scale.
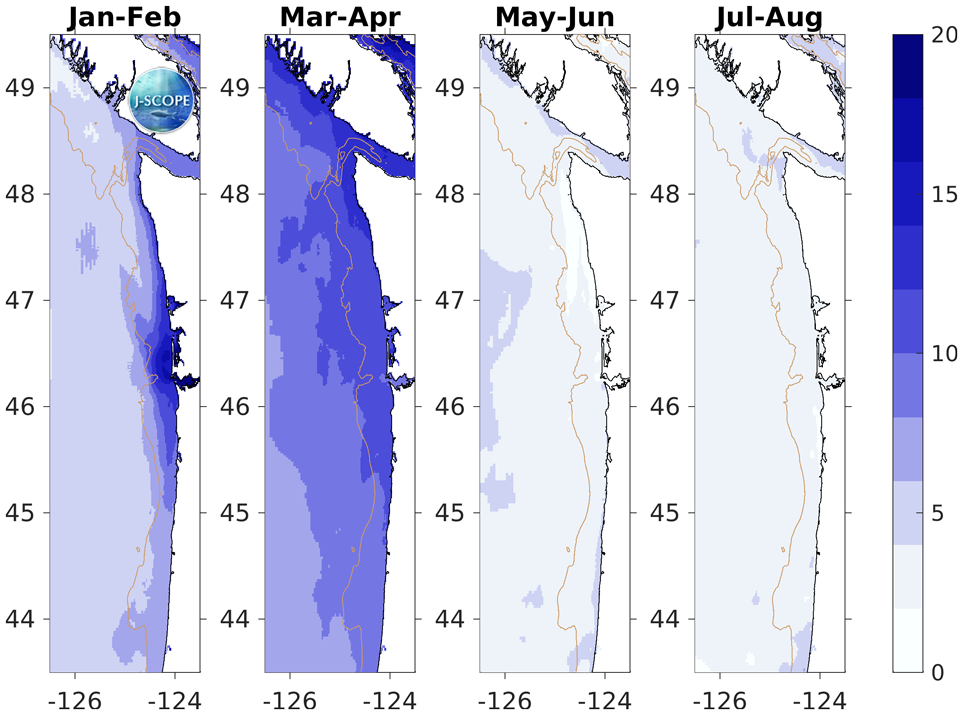
The relative uncertainty in percent for the modeled region SST values averaged in time for (from left to right) January – February, March – April, May – June, and July – August. The relative uncertainty is defined as the standard deviation of the ensemble divided by the mean of the ensemble and is reported as a percentage of the mean.
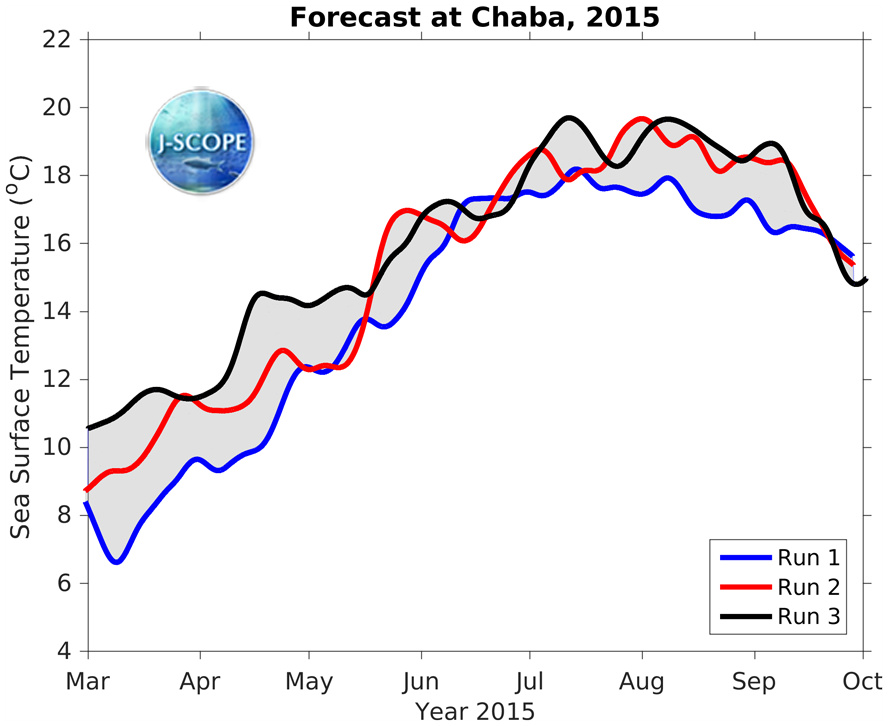
Time series for SST at Ćháʔba· (~48 N) for each of the three ensemble members.
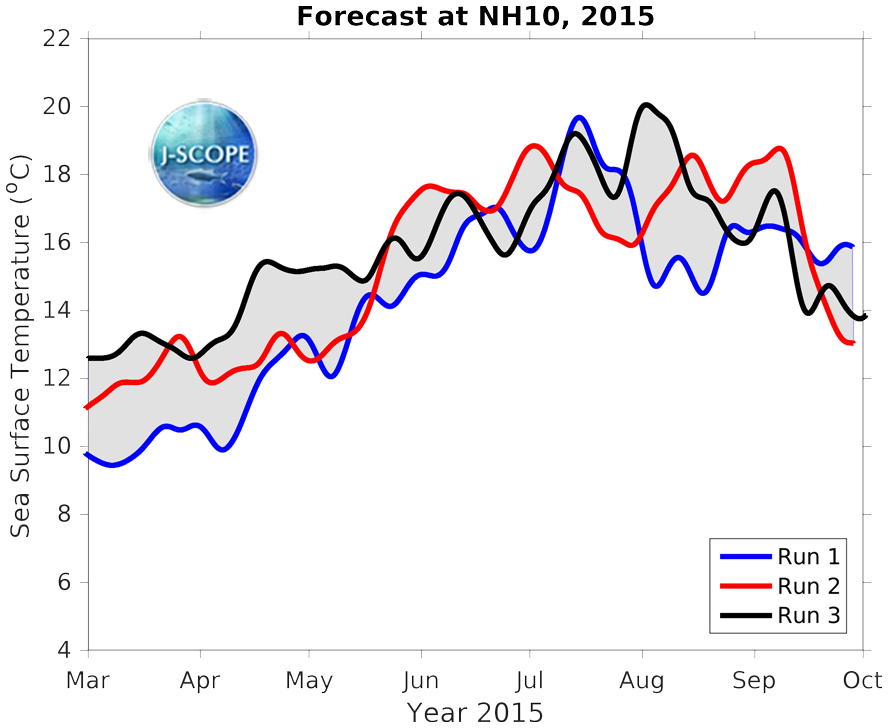
Time series for SST at NH-10 (~44.5 N) for each of the three ensemble members.