Forecast Origin Dates
J-SCOPE forecast results for the model run beginning in January of 2017 are shown in the first figure. Each panel represents ensemble averaged anomalies of two month averages for the region. The panels directly under the climatology depict the relative uncertainty from the ensemble for the same time period.
For waters off the Washington coast, the forecast projects that 10-meter integrated Chlorophyll will be lower than climatology in early averaged time-periods (January - February, March - April, May - June, and July - August) on the Washington shelf for 2017. The relative uncertainty is highest (40%) right along the coast in late summer (August - September) and initially (January - February).
For the waters off the Oregon coast, a slightly different pattern is seen. The forecast projects the 10-meter integrated Chlorophyll to be higher than the climatology on the Oregon shelf during the spring time-periods (March - April, May - June) for 2017, but lower than the climatology during the January - February and July - August time periods. Relative uncertainty is highest (50%) everywhere in the domain initially, the uncertainty is also high at the end of the forecast (July - August).
The high uncertainty is caused by the disparity between the three ensemble members wind forcing, see California Current Indicators.
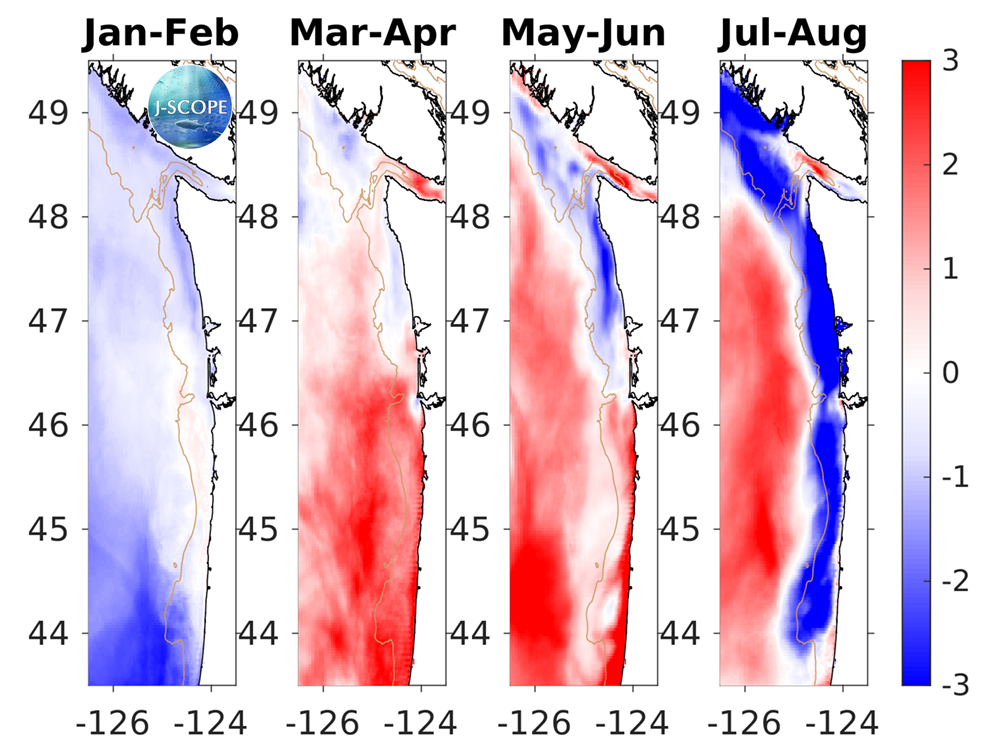
The modeled region chlorophyll anomaly values integrated over the surface 10 meters (in mg/l), and averaged over all three ensemble members and in time for (from left to right) January - February, March - April, May - June, and July - August.
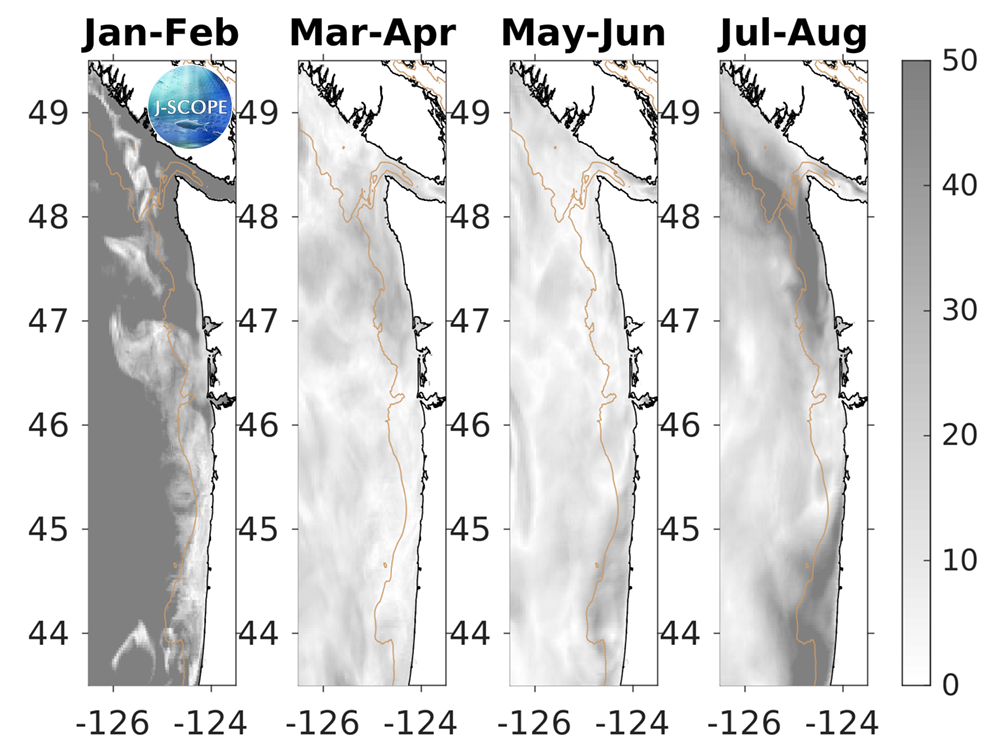
The relative uncertainty in percent for the modeled region chlorophyll values integrated over the surface 10 meters, and averaged in time for (from left to right) January - February, March - April, May - June, and July - August. The relative uncertainty is defined as the standard deviation of the ensemble divided by the mean of the ensemble and is reported as a percentage of the mean.