Forecast Origin Dates
J-SCOPE forecast results for the simulation beginning in April of 2018 are shown through a series of figures below. In the first figure, each panel represents a two-month average for the region averaged over three model runs of the ensemble. The panels directly under the anomaly plots depict the relative uncertainty from the ensemble for the same time period.
For waters off the Washington coast, the forecast projects that SST for shelf and offshore waters will be slightly warmer than climatology throughout the upwelling season (May - August). SST is forecasted to be near climatology for shelf waters in September - October, but warmer than climatology in November - December. The relative uncertainty is low initially (<10%) but increases over time and peaks in September - October.
For the waters off the Oregon coast, the forecast projects that SST will be near climatology throughout the upwelling season, but anomalies will increase later in the year (September - December) for both shelf and offshore waters. The relative uncertainty is low initially (<10%) but increases over time and peaks in September - October.
The SST was forecast using all three model runs of the ensemble for three point locations where buoys exist, Ćháʔba· off La Push, Washington, NH-10 off Newport, Oregon, and CE042 in the Olympic Coast National Marine Sanctuary, are shown at the bottom of the page. In comparison to the climatology, the three ensemble members indicate approximately climatological SSTs initially (May - June), with a the forecast favoring warmer conditions in late summer and early fall (July - August; October - December), although there is a lot of uncertainty in the forecast in late summer, early fall.
Finally, climatological cross-sections from the Newport Line in Oregon (44°N), as well as the Grays Harbor Line in Washington (47°N), are compared to the forecasted average of the ensemble members. The forecast projects that subsurface temperatures are projected to be near climatological in both Washington and Oregon.
We note that the NANOOS Climatology app shows that the NDBC buoys along the Washington and Oregon shelf are recording sea surface temperatures that are slightly warmer than the long-term averages since the start of the 2018 upwelling season. One bias is known to exist in the forecasted SSTs: The modeled shortwave radiation is known to be too high (see 2013, Year in Review), which can contribute to forecast temperatures being too warm in summer. By presenting these forecasts as anomalies, the representation of this bias is reduced, but efforts are being researched currently to further correct for this bias going forward.
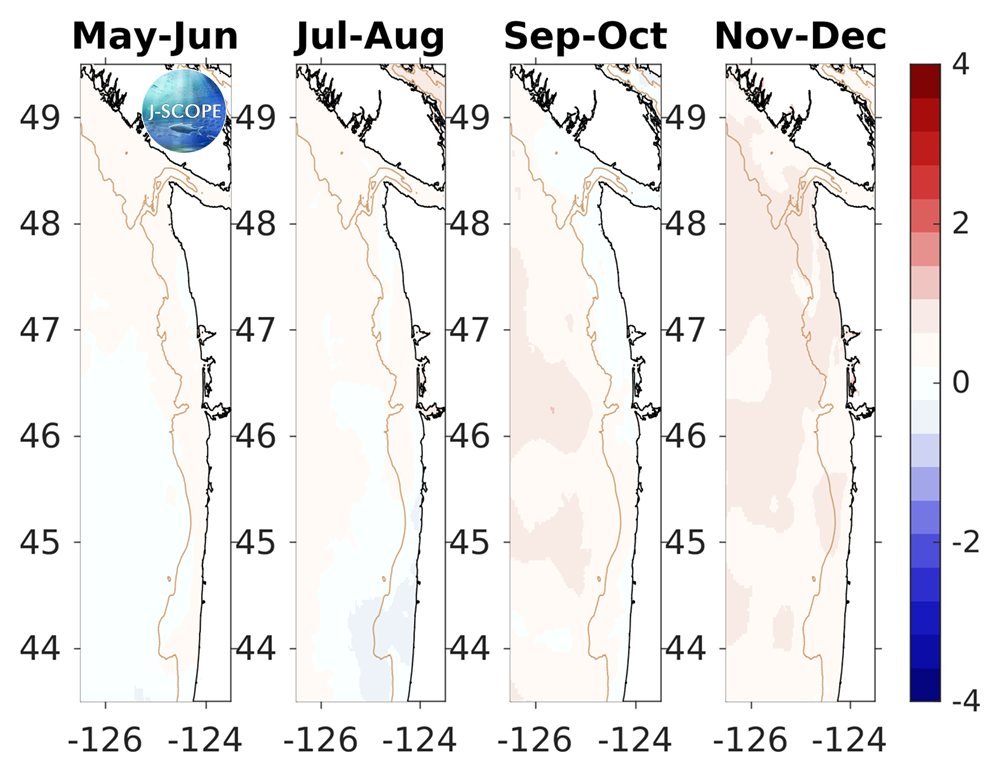
The modeled region SST anomaly averaged over all three ensemble model runs and in time for (from left to right) May - June, July - August, September - October, November - December.
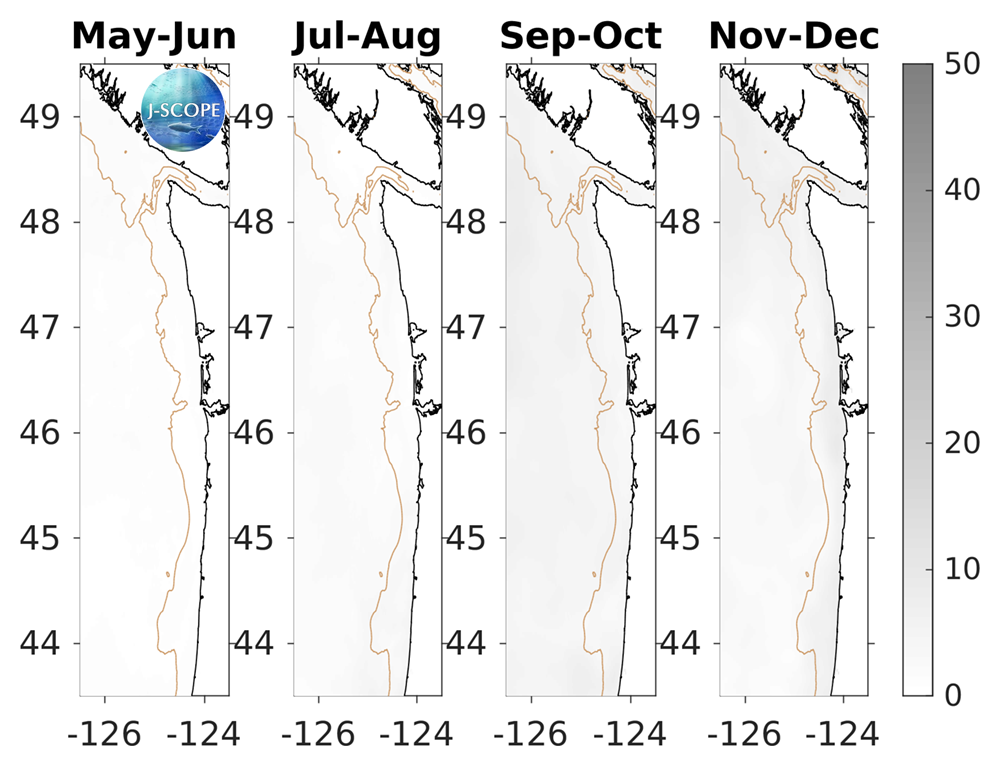
The relative uncertainty in percent for the modeled region SST values averaged in time for (from left to right) May - June, July - August, September - October, November - December. The relative uncertainty is defined as the standard deviation of the ensemble divided by the mean of the ensemble and is reported as a percentage of the mean.
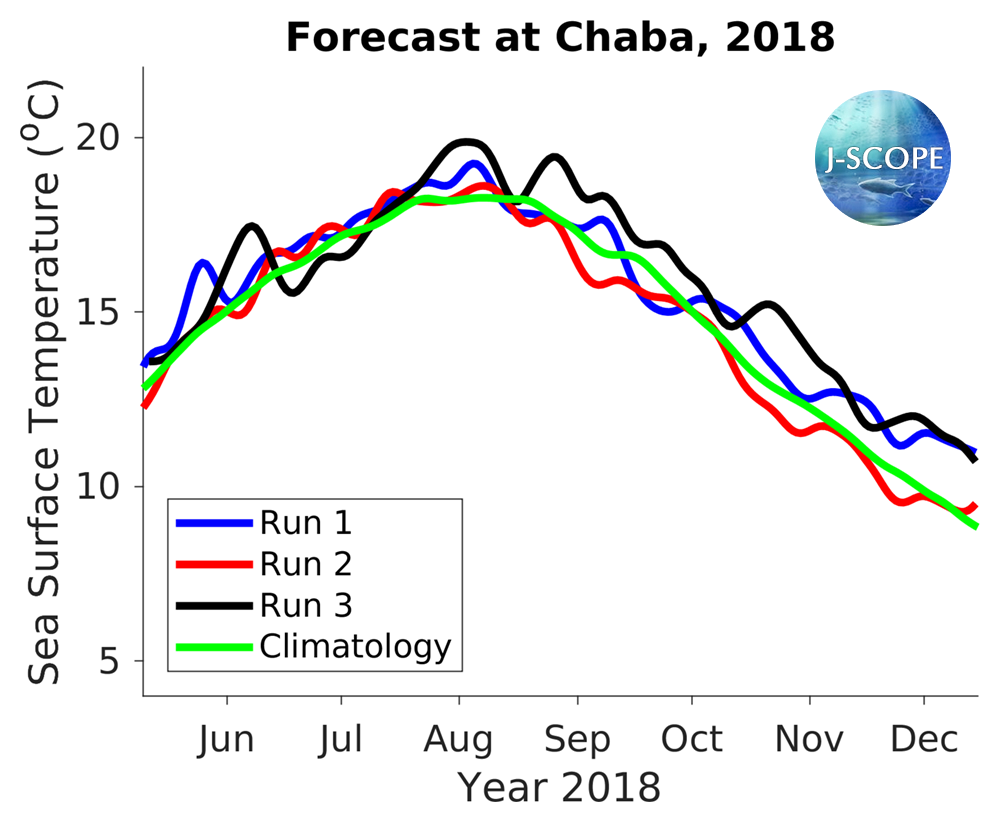
Time series for SST at Ćháʔba· (~48°N) for each of the 3 ensemble members; climatology for this station shown in green.
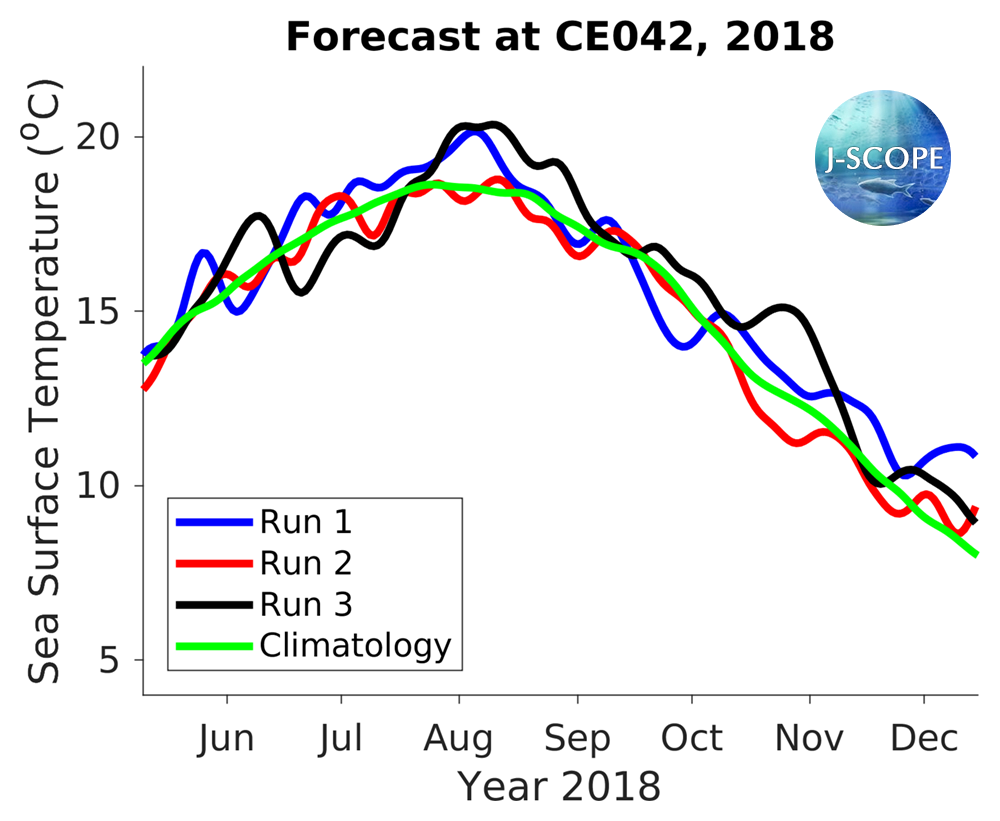
Time series for SST at CE042 (~47.5°N) for each of the 3 ensemble members; climatology for this station shown in green.
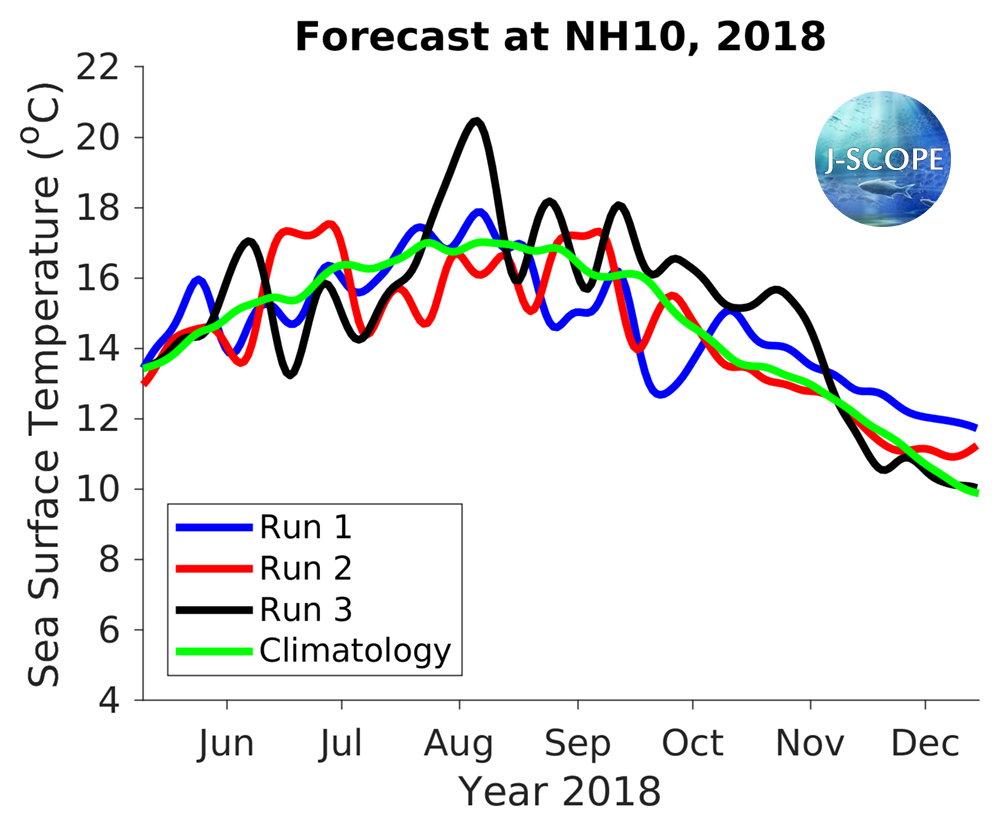
Time series for SST at NH-10 (~44.5°N) for each of the 3 ensemble members; climatology for this station shown in green.
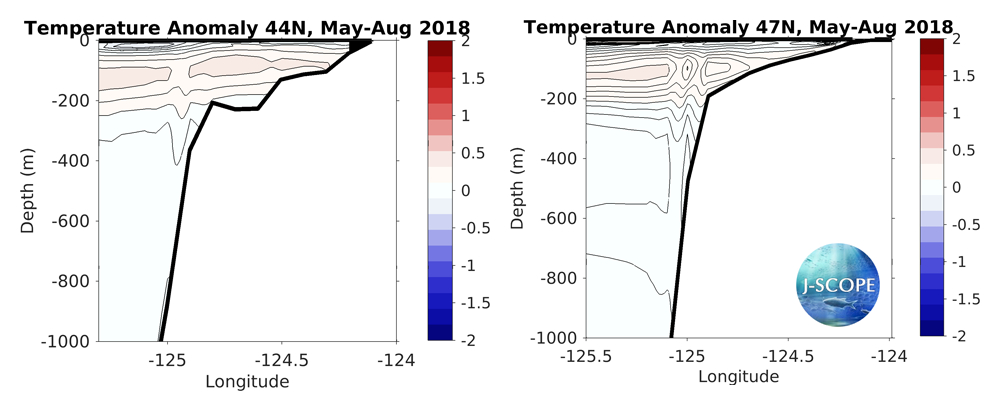
The modeled cross-section from the Newport Line (left, 44°N) and the Grays Harbor Line (right, 47°N), averaged over all three ensemble members, and averaged over the summer upwelling months (May - August). These cross-sections are anomalies from the April-initialized reforecast climatology.