Forecast Origin Dates
J-SCOPE forecast results for the simulation beginning in January of 2022 are shown through a series of figures below. In the first figure, each panel represents two-month ensemble averaged anomalies for the region. The panels directly under the anomaly plots depict the relative uncertainty from the ensemble for the same time period.
One bias is known to exist in the model that impacts these forecast SSTs. The modeled shortwave radiation is known to be too high (see 2013, Year in Review), which can contribute to forecast temperatures being too warm in summer.
For waters off the Washington and Oregon coast, the forecast projects that SST will be near climatological throughout the forecast, including the upwelling season. The relative uncertainty is very low (<10%) for the entire forecast.
The SST was forecast using all three model runs of the ensemble for three point locations where buoys exist, Ćháʔba· off La Push, Washington, NH-10 off Newport, Oregon, and CE042 in the Olympic Coast National Marine Sanctuary, are shown below. All three indicate near climatological SSTs during the summer upwelling season.
Finally, climatological cross-sections from the Newport Line in Oregon (44°N), as well as the Grays Harbor Line in Washington (47°N), are compared to the forecast average of the ensemble members. The forecast projects that, concurrent with the SST being near climatological, subsurface temperatures are also near climatology throughout the water column along the Grays Harbor Line or the Newport Line.
We note that the NANOOS Climatology App shows that the NDBC buoys along the Washington and Oregon shelf are recording sea surface temperatures near or slightly warmer than the long-term averages since the start of 2022.
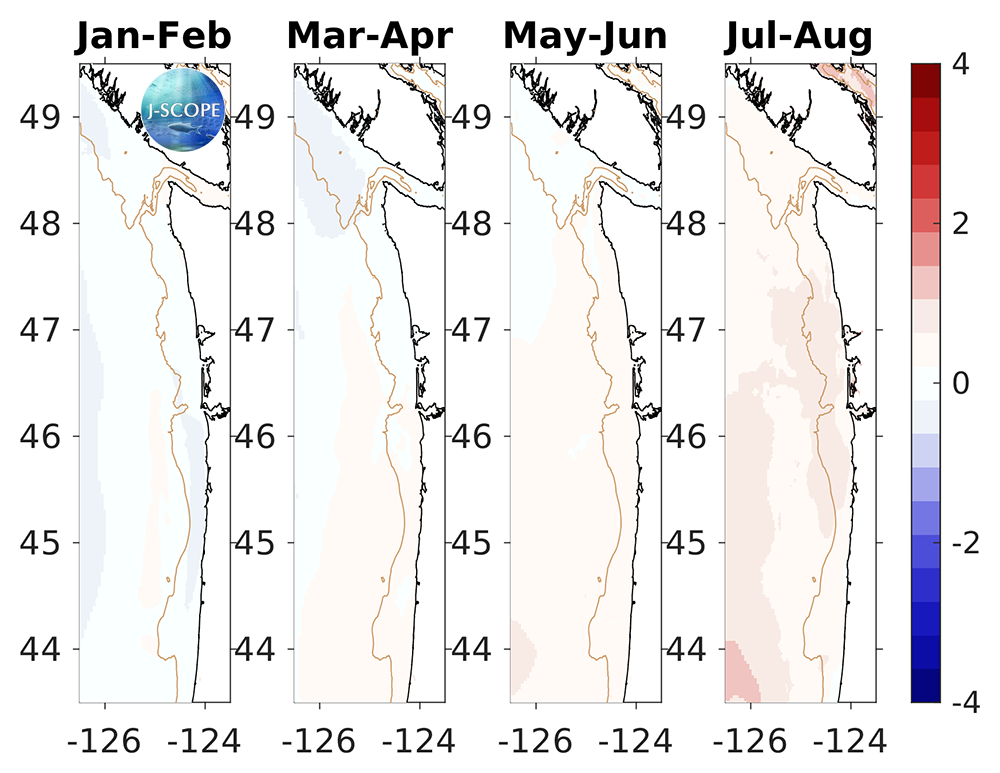
The modeled region SST anomaly averaged over all three ensemble model runs and in time for (from left to right) January - February, March - April, May - June, July - August.
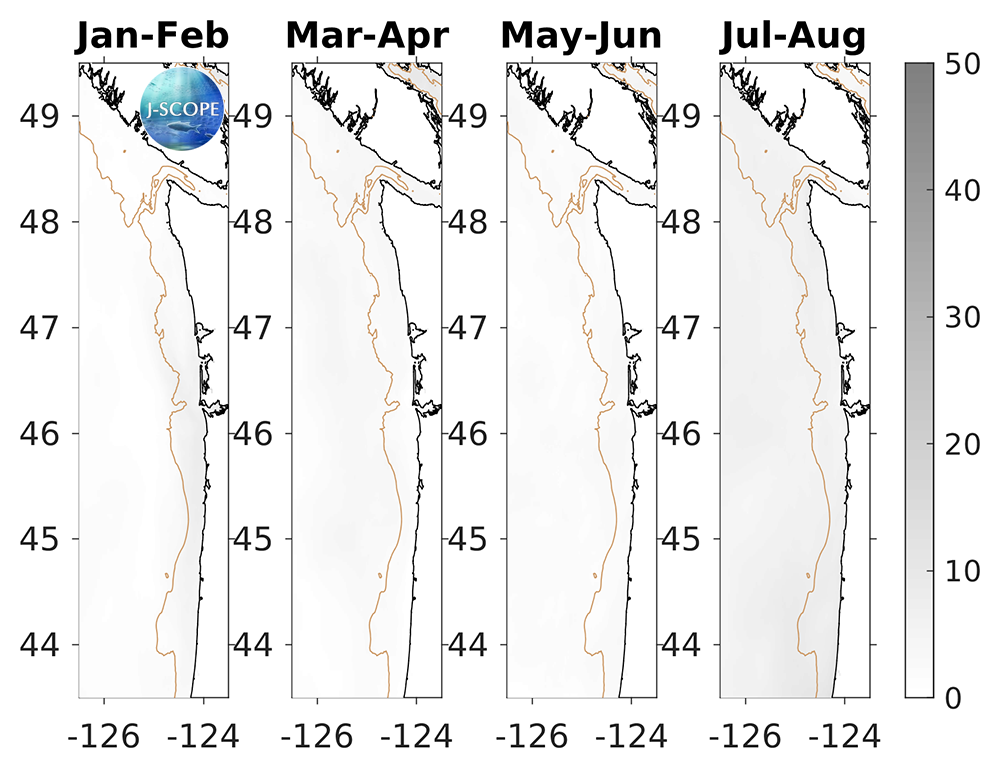
The relative uncertainty in percent for the modeled region SST values averaged in time for (from left to right) January - February, March - April, May - June, July - August. The relative uncertainty is defined as the standard deviation of the ensemble divided by the mean of the ensemble and is reported as a percentage of the mean.
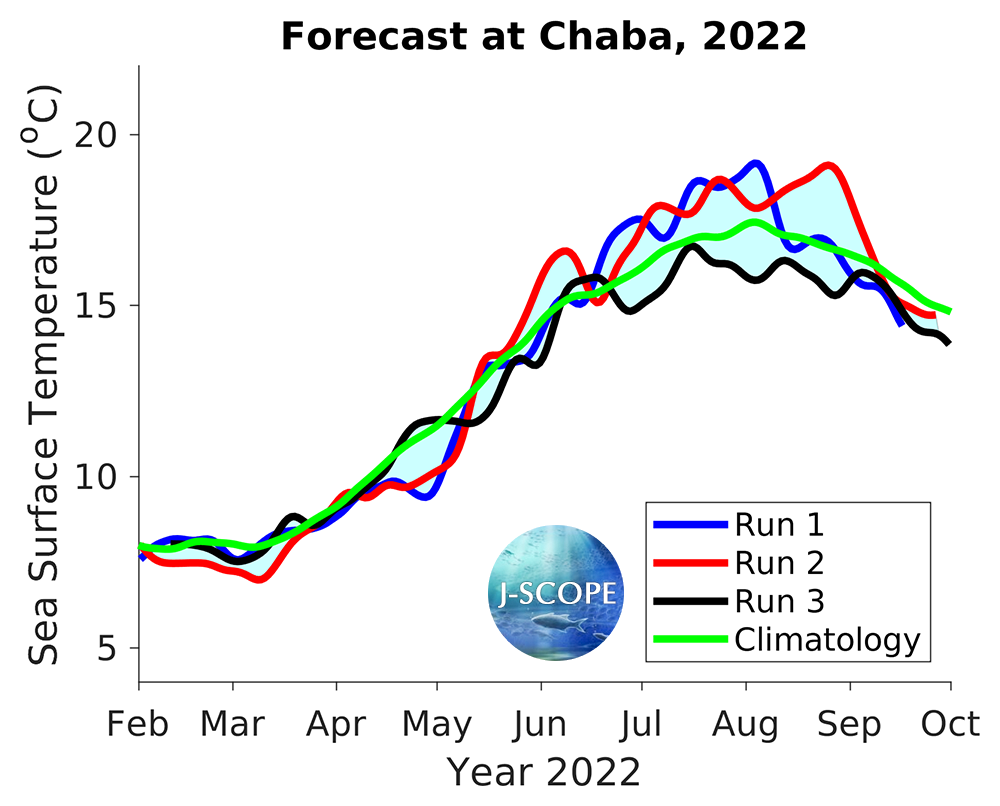
Time series for SST at Ćháʔba· (~48°N) for each of the 3 ensemble members; climatology for this station shown in green.
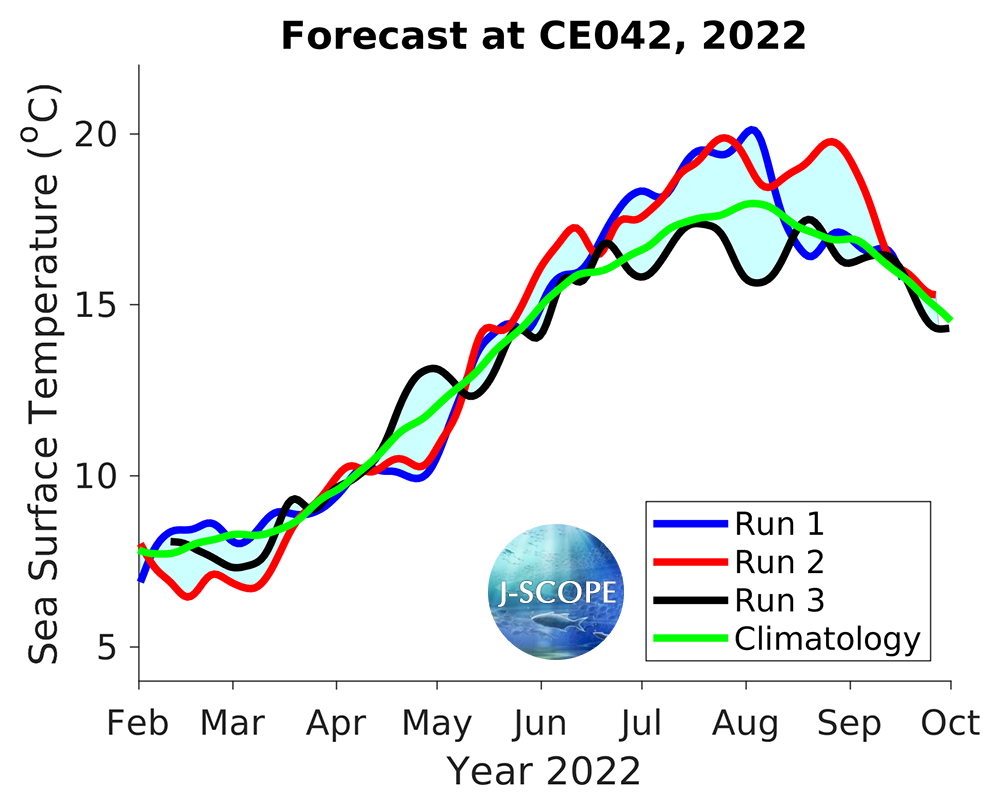
Time series for SST at CE042 (~47.5°N) for each of the 3 ensemble members; climatology for this station shown in green.
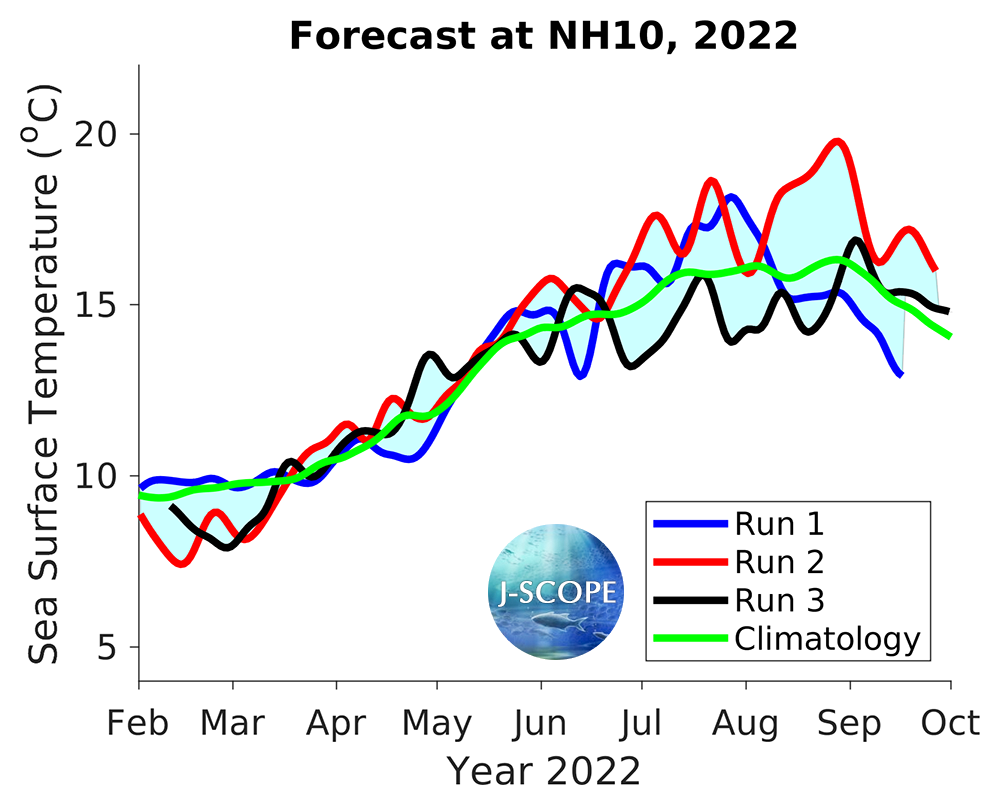
Time series for SST at NH-10 (~44.5°N) for each of the 3 ensemble members; climatology for this station shown in green.
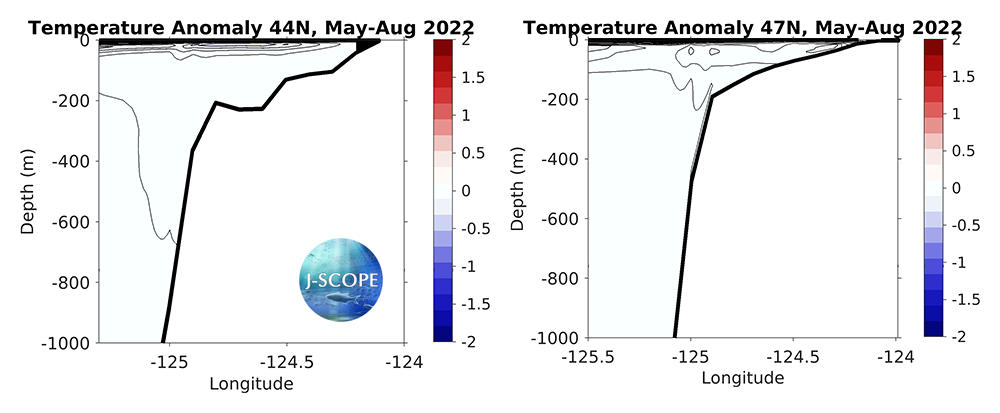
The modeled cross-section from the Newport Line (left, 44°N) and the Grays Harbor Line (right, 47°N), averaged over all three ensemble members, and averaged over the summer upwelling months (May - August). These cross-sections are anomalies from the January-initialized reforecast climatology.